 Following last weeks’ multibeam sonar survey, the bed of Lake Rotomahana has now been mapped to a resolution of half a metre, bringing to light a mass of detail hitherto unknown to scientists.
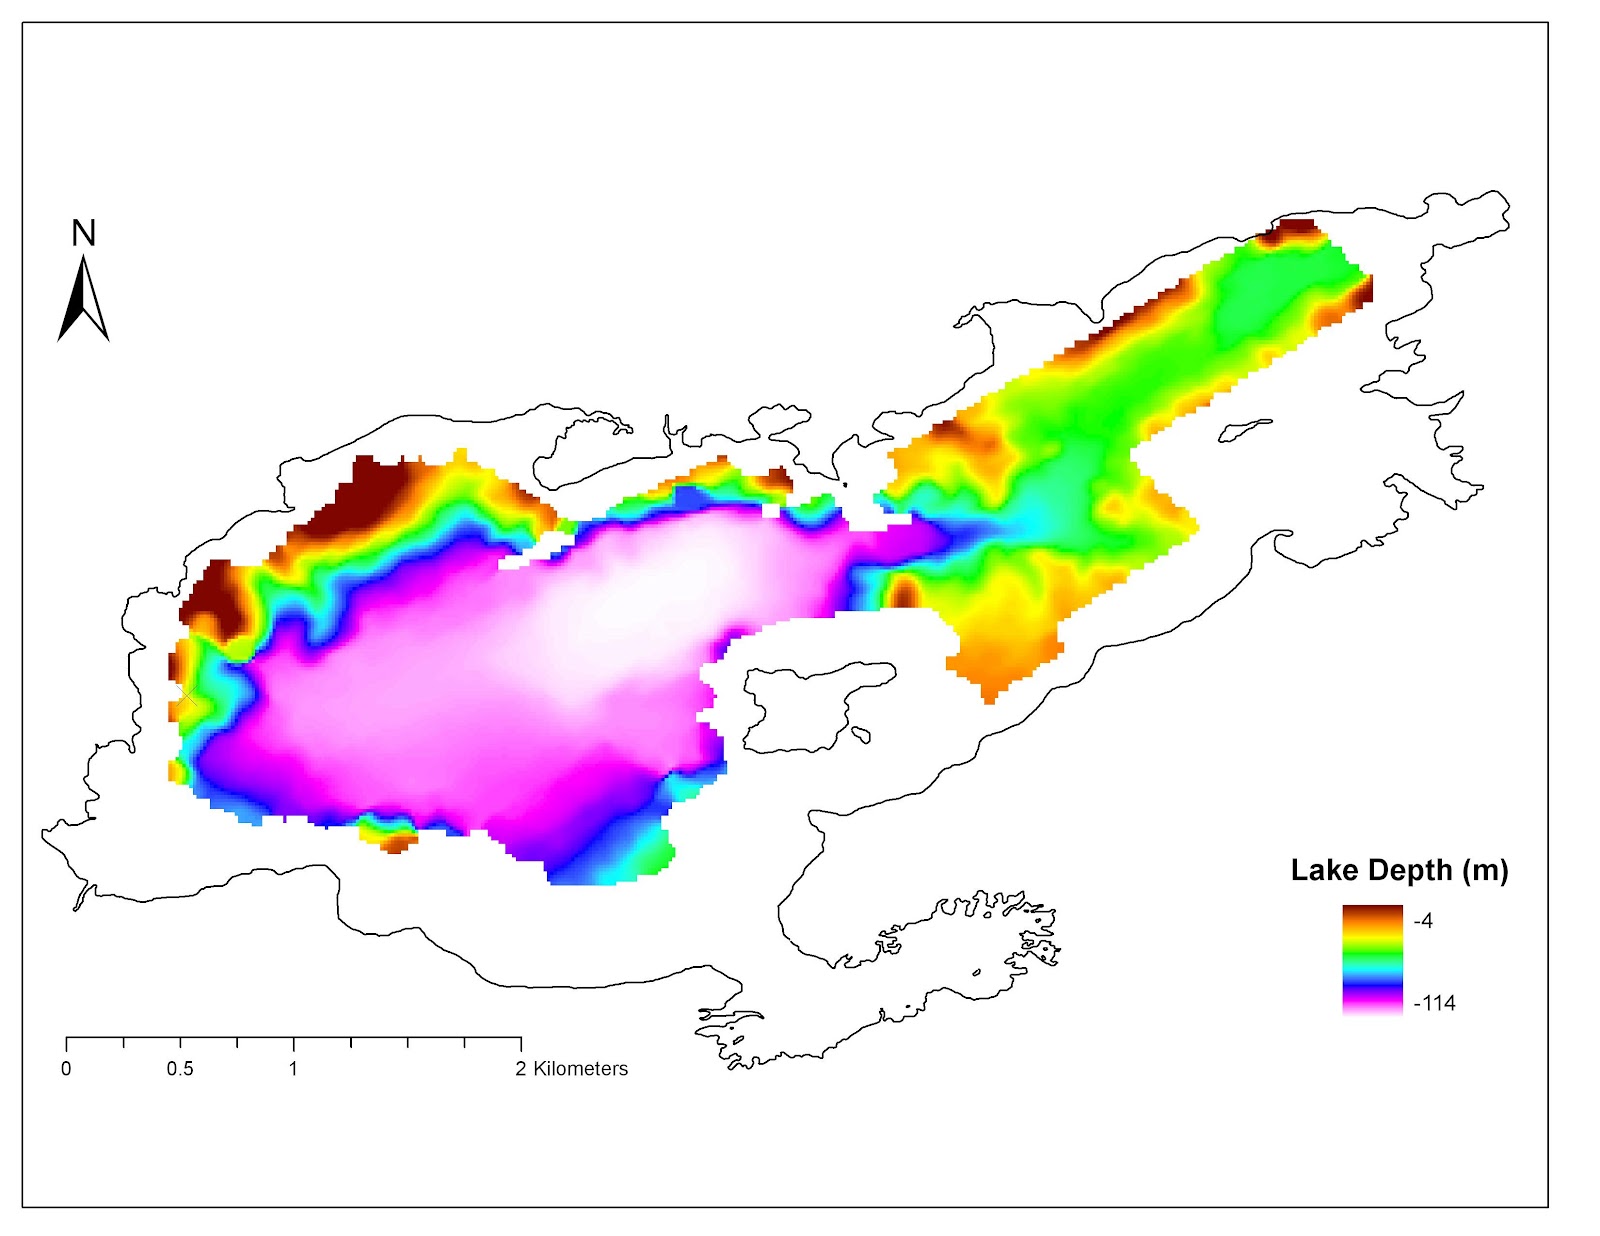
The first photo shows last year’s map which was made with the assistance of WHOI (Wood’s Hole Oceanographic Institution). The resolution of the map is 15 metres. This year, with the help of ixSurvey, we have improved that by 30x (second image). In this post I will show you some of the features that have come to light.
The colour scale indicates depths in metres. Red represents the shallowest depths found around the shoreline, down to blue which is deepest in the main central part of the lake. The maximum depth is about 115 metres. The grey area is the land around the lake that is above water level, or very shallow parts of the south side of the lake that were not scanned. Click on the image for a larger view.

The map we now have allows close up study of many fascinating features that we can see for the first time. In the third image showing the northern margin of the lake, you can see two explosion craters right on the very edge. They are about 25 metres deep. In the bottom right part of the image is a newly revealed crater, formed at a late stage in the 1886 eruption. Its rim is about 60 metres below the surface, and its floor is at about 80 metres. All of these craters are approximately 100 metres across.

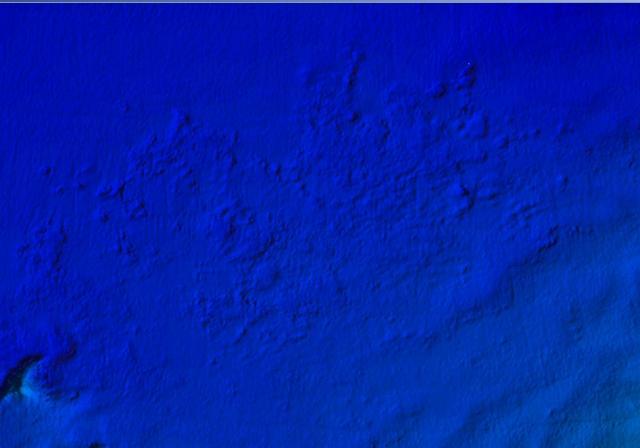
If you click on this image of the flat, deepest part of the lake (blue area), you might just discern a faint circular feature just below and to the right of centre. This is also about 100 metres across and may be the outline of a crater rim that has been almost totally obscured by mud, or it may be the lobe shape of a debris flow that cascaded down from the north, leaving a smooth gouge in the slope (upper part of the picture).

In the lower (southern) part of the map there are many erosion features visible on the sloping lake floor. On the left of this image you can see some eroded gullies extending down from the red area (-20m) into the blue (-100m). We believe these runnels formed in the few years after the Tarawera eruption, before the lake filled up, rather than that they were eroded after the water level rose. On the right hand side of the image, there is another area of radiating features. These have quite a different character, being less smooth, and with intriguing lines of hollows. These may have formed as a result of the wave like flow of debris down the slope, but we are uncertain as to why they are so different to the features just to the left (west).
 The southern half of the blue area on the map has a lot of gas activity. This was noticed last year on some of the sidescan images showing plumes of bubbles arising from a pick marked area on the bed of the lake. This activity has increased dramatically in this part of the lake floor since the Tarawera eruption.
Now we can see this area of hydrothermal and gaseous activity in detail, with the ‘pock marks’ showing up as a mass of small vents scattered over a wide area. These are each up to a few metres across.
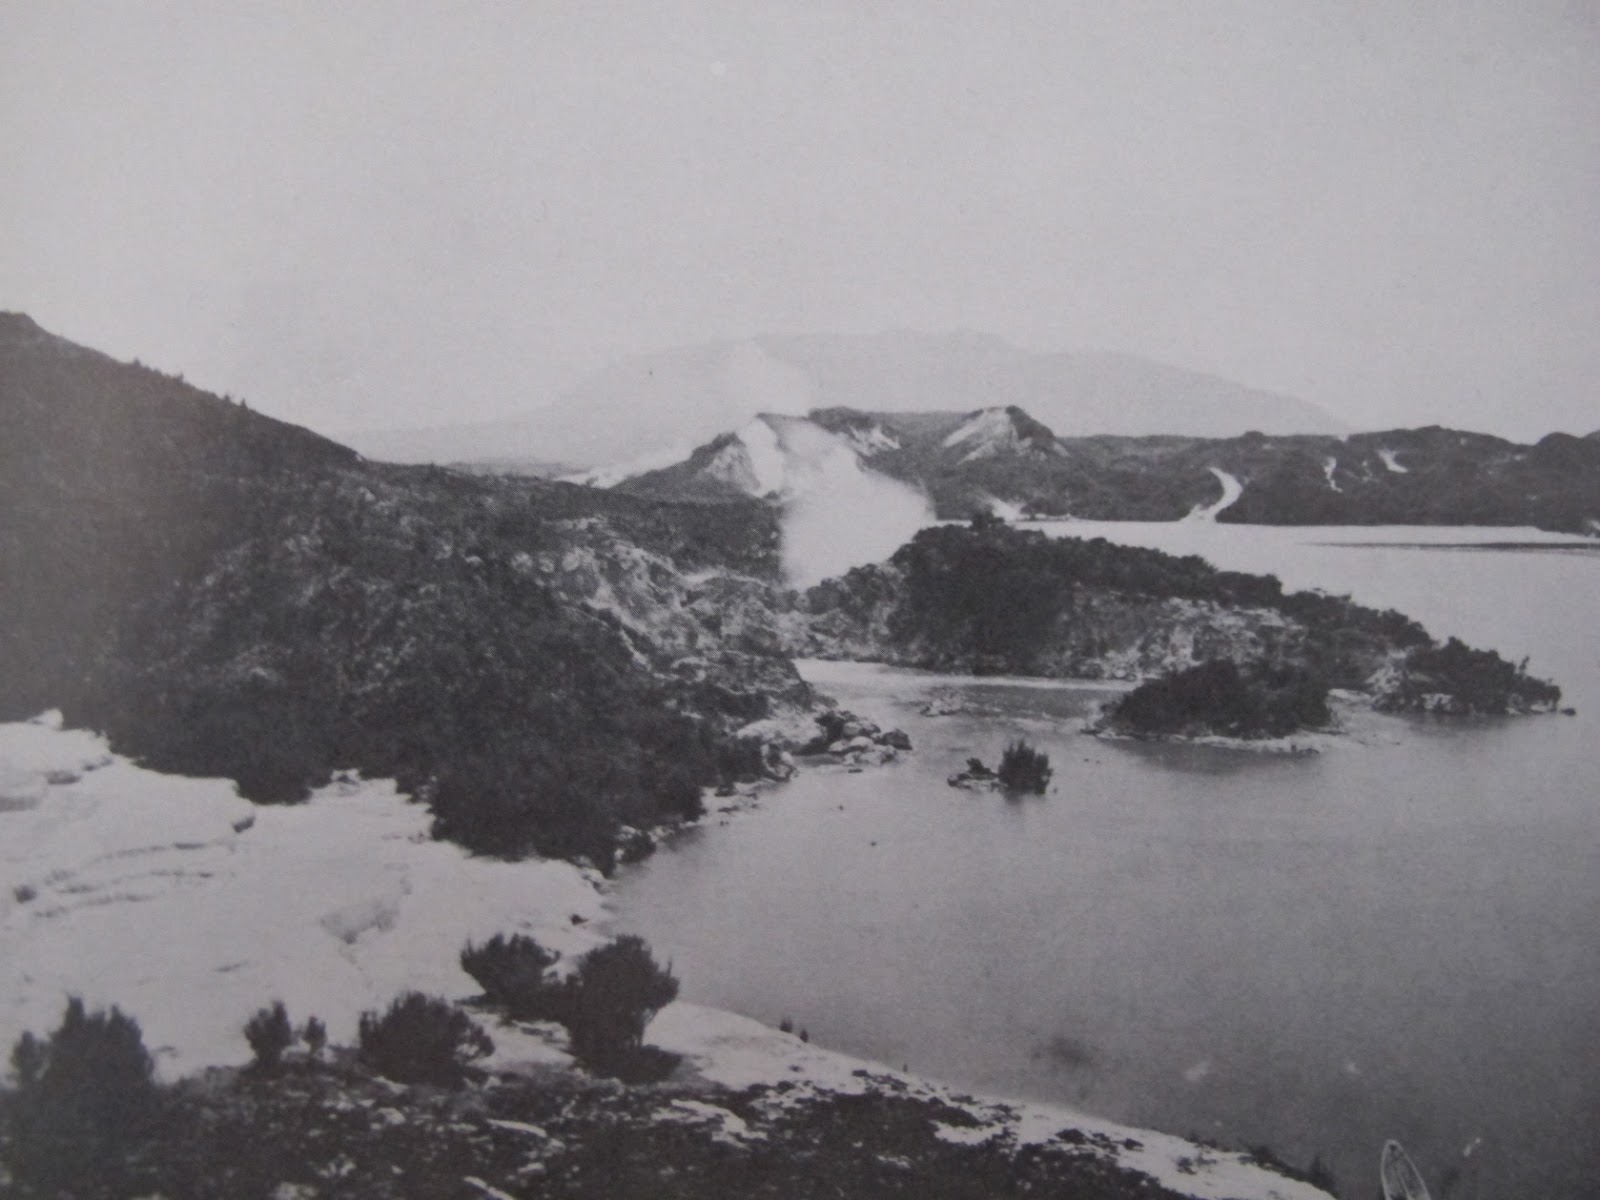
A very significant feature that was revealed in last years’ bathymetric map was the ‘spit’ or promontary that is shown on early photographs of the Pink Terraces. It is extending into the lake in the middle distance of this photograph, not far to the east of the Pink Terraces visible in the left foreground. The spit rises several metres above water level. (Image courtesy of the Alexander Turnbull Library, Wellington)

On our new bathymetric map we can clearly see the promontary, now with its crest below 50 or 60 metres of water.