Kaikoura

Landslide Dam

Seaward Slide, J.Thomson @ GNS science Rockfalls and landslides were one of the dramatic consequences of the M7.8 Kaikoura Quake. This first photo shows one that is actually so huge that you might not at first recognise it for what it is. The white cliff in the distance is the landslide scarp and the huge green capped pile of grey in the middle distance is the debris that fell away. This landslide was of course made famous on TV by the cows that became trapped on an isolated hummock in the debris pile. SH1 and Railway, Steve Lawson @ GNS Science A large number of coastal cliffs collapsed, causing spectacular damage to the coastal transport infrastructure. In this image you can see how the raiway line has been lifted up and dropped across the road and across the beach. J.Thomson @ GNS Science Another example of rockfall damage along the coast: Hapuku Landslide, Steve Lawson @ GNS Science In the Canterbury ranges, a short distance inland, a number of landslides have blocked river valleys and created landslide dammed lakes that are now filling up. This image shows the massive Hapuku landslide, which has buried the valley in over 150 metres of debris, weighing many millions of tonnes. The grey coloured lake in the centre of the image is a couple of hundred metres long Hapuku landslide, J. Thomson @ GNS Science This is a close up view of the lake taken a few days later. The lake is now near to the point of overflowing the dam. The problem with these dams is that they can fail catastrophically, sending a debris flow of water, mud and rock down the valley with potentially very destructive consequences. Linton landslide survey, J.Thomson @ GNS Science In this image you can see another landslide, this time in the Linton Valley. It has also dammed a small river. The team here are surveying the debris and the shape of the valley in order to calculate the possible downstream consequences of a breach of the dam. Linton landslide, J.Thomson @ GNS Science This photo shows the size of the landslide.  A large section of forest has slid down with it with many trees still standing. The debris has again blocked the valley to form a lake. Linton landslide dam, J.Thomson @ GNS Science The lake level is still about 10 metres below the rim of the dam: Linton landslide dammed lake, J.Thomson @ GNS Science In order to measure the lake’s water level safely, Chris Massey took a GPS reading from the helicopter whilst it hovered just above the water surface. Linton landslide, J.Thomson @ GNS Science Meanwhile at the base of the dam, some water is percolating through the debris, although the flow in the stream bed is much less than usual: Linton landslide, J.Thomson @ GNS Science This photo shows the toe of the landslide – a mass of rock debris and damaged trees. Linton landslide, J.Thomson @ GNS Science By the end of a few hours, we had lots of data in the form of laser scans of the slip from different locations, as well as hundreds of drone and aerial photos, which are combined to make a 3D digital image that can be used to model the possible consequences of the dam breaching in different ways. This video made by Steve Lawson is a virtual ‘fly through’ of the digital model: And here is a short video about these landslide dams: Finally, there is more information about landslides on the GeoNet website here

Landslide Dam Read More »

The Kekerengu Fault

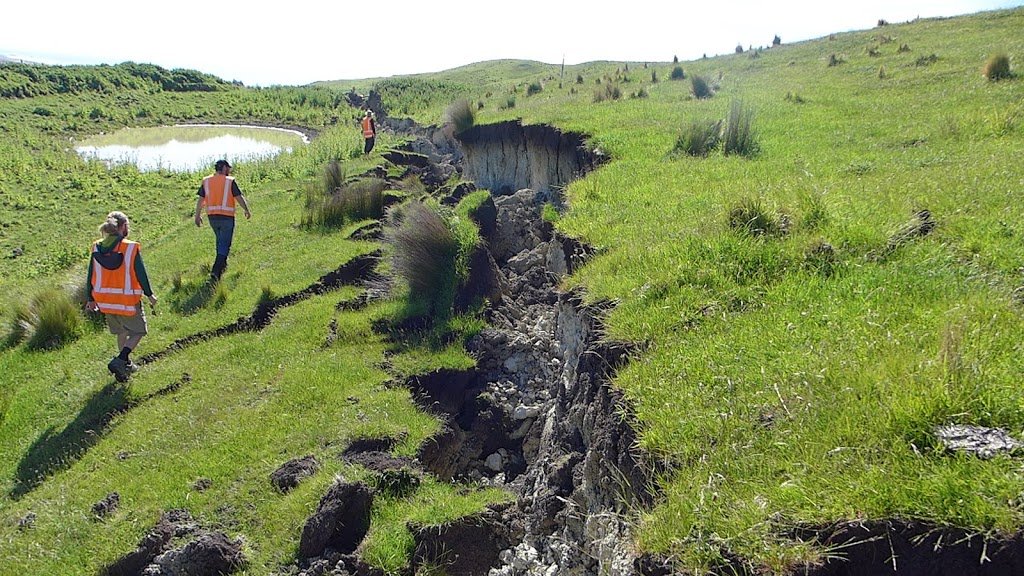
Photo Tim Little @ VUW Whilst there were many faults that ruptured during the recent M7.8 Kaikoura Earthquake, the Kekerengu Fault is perhaps the most awe inspiring in terms of its effect on the landscape and infrastructure. As it ripped through the countryside, it displaced the land to either side by an astonishing 8 to 10 metres sideways and about 2 metres vertically over many kilometres of its length. Kekerengu Fault offset, J.Thomson @ GNS Science In places this horizontal offset is even more – up to a whopping 12 m. This is impressive on a global scale. In the first two images here you can see what this looks like where farm tracks have been sliced through at a right angle. Here is a drone’s eye view from above: Kekerengu Fault,   J.Thomson @ GNS Science As the trace of the fault passes through different locations, it expresses itself in a number of ways. Across the river from Bluff Station, it has opened up an enormous crevasse, not unlike the sort of thing that mountaineers often see on a glacier. This will be due to either a slight bend in the fault trace, and/or slumping of the downhill side of the fault where there is a slope. Kekerengu Fault,   J.Thomson @ GNS Science Slickensides is the name given to the scrape marks  on the surface of the wall of a fault. Here you can see that they are dipping down at about 28 degrees from the horizontal (towards the south-west). This is useful information to help understand the direction of movement of the rupture, and tells us that this fault moved obliquely (sideways and up).  When we looked across the fault we could see that the land on the far side had moved to the right. It is therefore a ‘dextral’ or ‘right lateral’ oblique slip fault. Kekerengu Fault,   J.Thomson @ GNS Science Fences are really useful markers to allow measurement of the fault offset, especially when they cross the fault at close to 90 degrees.as in this photo. Yes – those two lines of fencing used to join up! Kekerengu Fault,   J.Thomson @ GNS Science The hillside here appears scarred by a simple knife cut… Kekerengu Fault,   J.Thomson @ GNS Science …whereas in other places, the slip is distributed over a broad area of surface deformation. In this case it is likely that the groundshaking helped the hillside follow the call of gravity to spread the deformation over a large area. Kekerengu Fault,   J.Thomson @ GNS Science Near to the coast, the Kekerengu Fault tracks across this field towards the main state highway and the railway. Here the fault trace is a mound of huge clods of earth and ripped turf. We call this a “mole track”, and it results from some compression rather than extension along this part of the fault trace. Kekerengu Fault,   J.Thomson @ GNS Science Not far away, State Highway 1 has been pushed sideways in several pieces… Kekerengu Fault,   J.Thomson @ GNS Science and the nearby railway has been pulled so hard that it snapped. Kekerengu Fault,   J.Thomson @ GNS Science The fault runs right under this small bridge which is totally destroyed. Kekerengu Fault,   J.Thomson @ GNS Science Lots of food for thought and plenty of work ahead for earthquake scientist Russ van Dissen and his colleagues.

The Kekerengu Fault Read More »

A Ruptured Landscape

J,.Thomson @ GNS Science On the ground in the Kaikoura Quake aftermath: Following the recent M7.8 Kaikoura Earthquake, a number of teams of scientists have been deployed to survey the geological impacts and assess the potential ongoing risks to people and infrastructure. This gallery of images shows some of the numerous dramatic impacts of the quake in the coastal area to the north of Kaikoura.  J.Thomson @ GNS Science Accessing the area by road involves careful driving. The road surfaces next to many of the bridges have subsided, creating a crack at either end of the bridge:  J.Thomson @ GNS Science Slumping has occurred along parts of the highway:  J.Thomson @ GNS Science This photo shows the now famous house at Bluff Station that had the mis-fortune to be built directly on top of the Kekerengu Fault. The house was shunted about 7 metres sideways leaving some of its foundations behind. J.Thomson @ GNS Science  The house was pushed across its own driveway… J.Thomson @ GNS Science  The coastal highway and railway have unfortunately been cut through in several places by fault ruptures. This view looking south at Waipapa Bay shows the northern branch of the Papatea Fault crossing SH1 and heading out to sea. J.Thomson @ GNS Science This is what the road now looks like on the ground. The fault scarp has been bulldozed to allow vehicle access. J.Thomson @ GNS Science A short distance away, the railway line was lifted up and dropped in the grass next to its original gravel bedding. J.Thomson @ GNS Science From the top of the fault rupture, you can see that the displaced railway tracks extend for about 300 metres into the distance. Will Ries @ GNS Science A few hundred metres further south, the southern branch of the Papatea Fault crosses the road and railway. J.Thomson @ GNS Science The earthquake ripped right through the concrete culvert that ran under the road, and again lifted the railway off its bed. J.Thomson @ GNS Science From the air, the scarp of the southern branch of the Papatea Fault is seen to extend like a knife-cut across the shore platform. In this image you can sea the uplifted coastline extending into the distance. The total uplift of the area left (east) of the fault is 5 to 6 metres, whilst the area to the right was uplifted by a smaller amount. Water has been ponded up against the new fault scarp. J.Thomson @ GNS Science A helicopter view showing the scarp of the Papatea Fault close up (across the top of image). The fault movement is thought to have been mostly horizontal with about 2 metres of vertical uplift in addition. J.Thomson @ GNS Science The Papatea Fault scarp is a sheer wall about 2 metres high. J.Thomson @ GNS Science Part of the task for scientists is to measure the uplift along the coast. The high and low water marks make a useful reference point that can be surveyed against the new sea level positions. J.Thomson @ GNS Science Sadly the raised shoreline stranded innumerable sea creatures that now litter the area amongst the seaweed. J.Thomson @ GNS Science Rockfalls have been numerous, and have caused a lot of damage where the road and railway are squeezed up close to the coastal cliffs. J.Thomson @ GNS Science The end of the road? The reason why you won’t be travelling into Kaikoura from the north anytime soon. This rockfall is at the south end of Okiwi Bay, and there are more slips like this further south. There are several GeoTrip locations that you can visit to see the changed landscape along the Kaikoura Coast such as this one 

A Ruptured Landscape Read More »