 There are three more days left before the scientists have to end the survey, and all systems are operating well.
A boat from the University of Waikato has been used for several different purposes, including a magnetometer survey and also CTD (Conductivity Temperature and Depth) measurements.
 Data from the different surveys are processed each day and combined to give an overview map of the lake floor and the distribution of its features.The imagery is starting to show the big picture, as well as some interesting details.
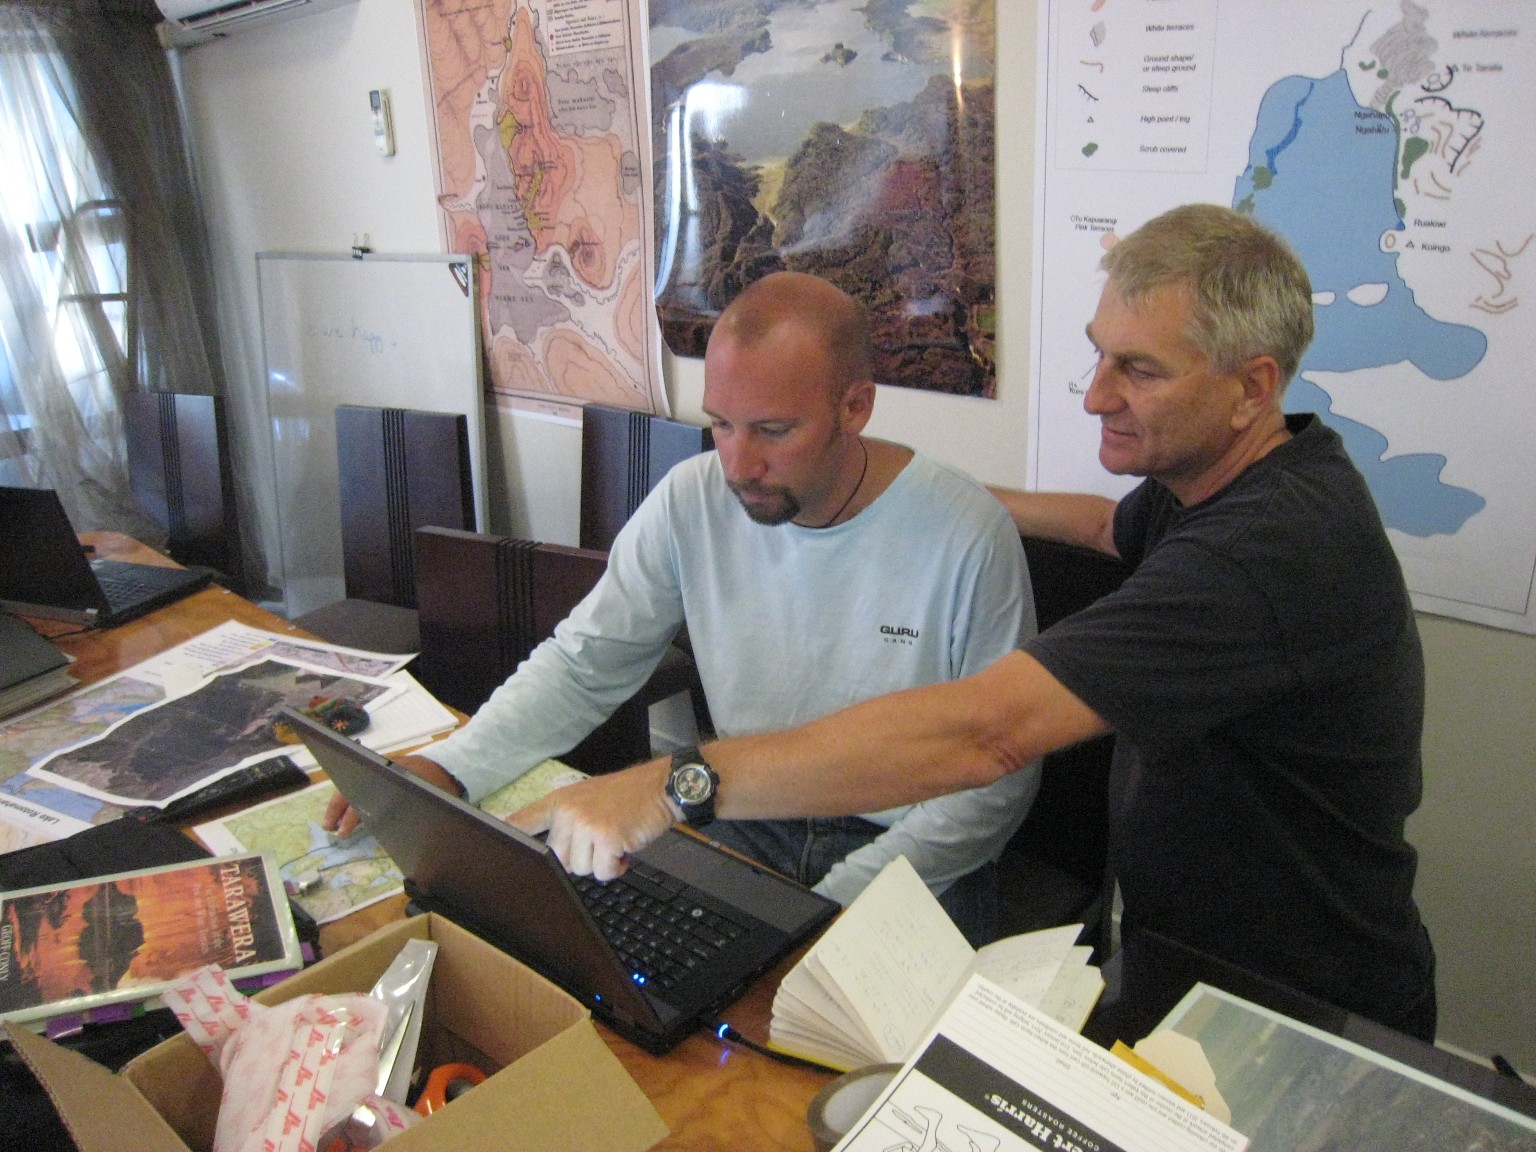
 In this second image, Cornel de Ronde is discussing the magnetic anomalies map that Fabio has devised from a grid survey of the lake. The boat tows the magnetometer behind it as it travels up and down in a grid pattern. This was aligned mostly at right angles to the volcanic rift, with a few lines along it to ‘tie’ the readings together across the gaps. You can see the grid pattern as dark lines in the third picture. They more or less cover the lake area, and are about 100 metres apart.
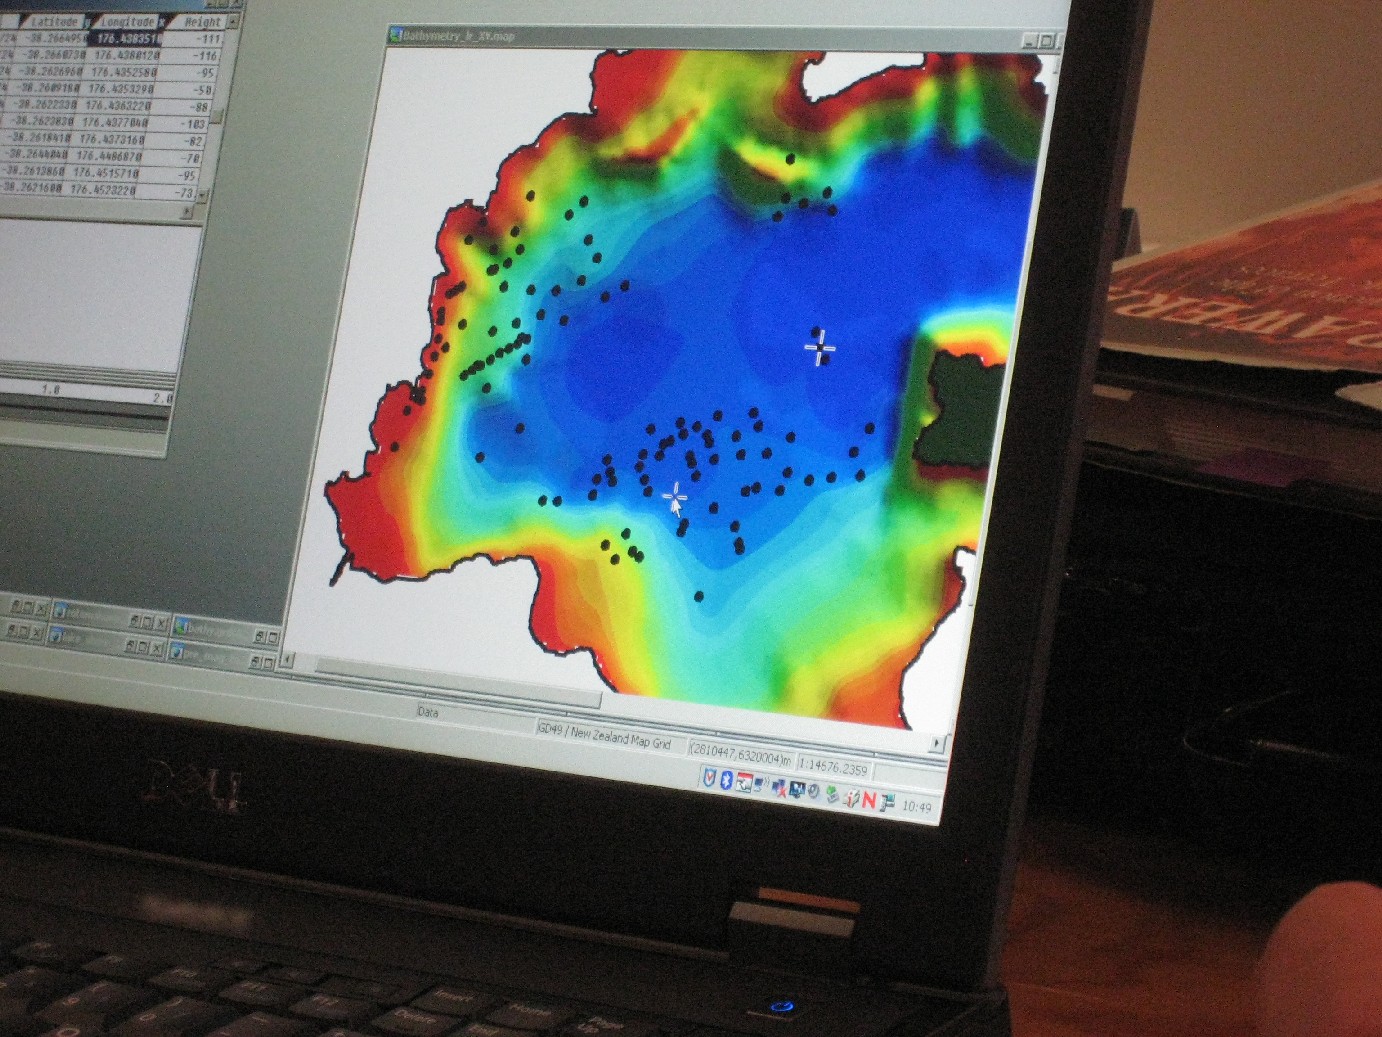 The colours on the map represent the intensity of the magnetic field as measured from the surface. They cover an area wider that the lake itself as readings were taken from the surrounding land as well. Blue and green show a low level, whilst red and pink indicate more intense magnetism. Volcanic rocks like basalt are typically very magnetic, but hydrothermal activity can alter the rocks and reduce the magnetism. This means that the measurements tell us something about the underlying geology below the lake as well as the distribution of hydrothermal activity.
The positions of hydrothermal vents have also been roughly plotted, but at this stage the locations are approximate.
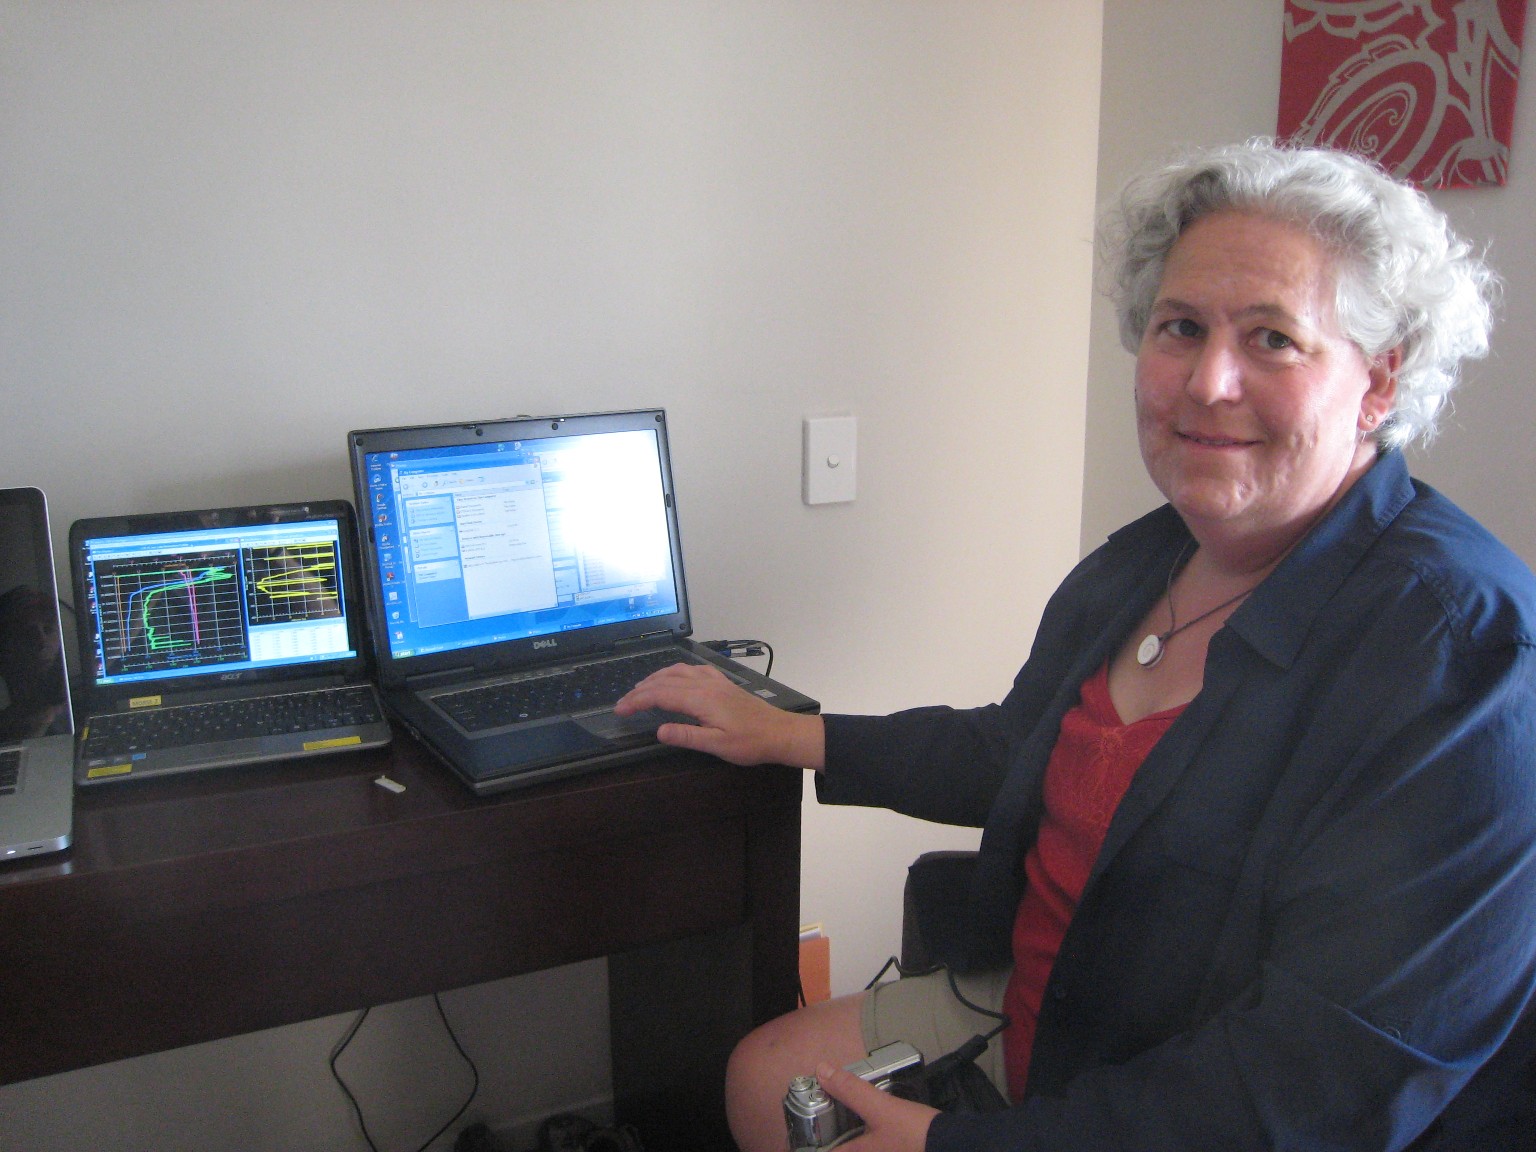 Sharon Walker processes the data from the CTD device that is lowered from the boat as it travels up and down. Different measurements can be combined to clarify the information about hydrothermal activity that affects the water above the lake floor.
The screen shows some readings from yesterday. On the left hand side, the blue line represents temperature, which is about 22 degrees C at the surface, but falls to roughly 14 degrees at 20 metres depth, and gets slowly cooler further down.
The green line is a measure of the amount of light scattering caused by particles in the water. Near the surface the reading is high, due to the presence of mud washed in by rain, as well as algae growing in the sunlight. Down near the bed of the lake there are some spikes that are caused by hydrothermal activity stirring up particles and introducing gas bubbles.
Hi Julian,
I think you're the GNS 'media' person Agnes (Mazot) was talking about so here's a video of the Rotomahana project on Maori channel I thought I'd share with you through here because I can't seem to post links on the GNS Science Facebook page. Link: http://www.youtube.com/watch?v=xnU-WYSzUdY&feature=channel
Cheers