
This week I have been with Cornel de Ronde and a group of ocean floor researchers applying more of their methods to expand the large amount of research of Lake Rotomahana done over recent years.

This is the lake that used to be decorated by the famous Pink and White Terraces. It was excavated by the extreme violence of the Mount Tarawera eruption in June 1886. This photo of a cliff section in the nearby Waimangu Valley, shows a black horizontal soil layer that was buried by volcanic mud during the eruption.
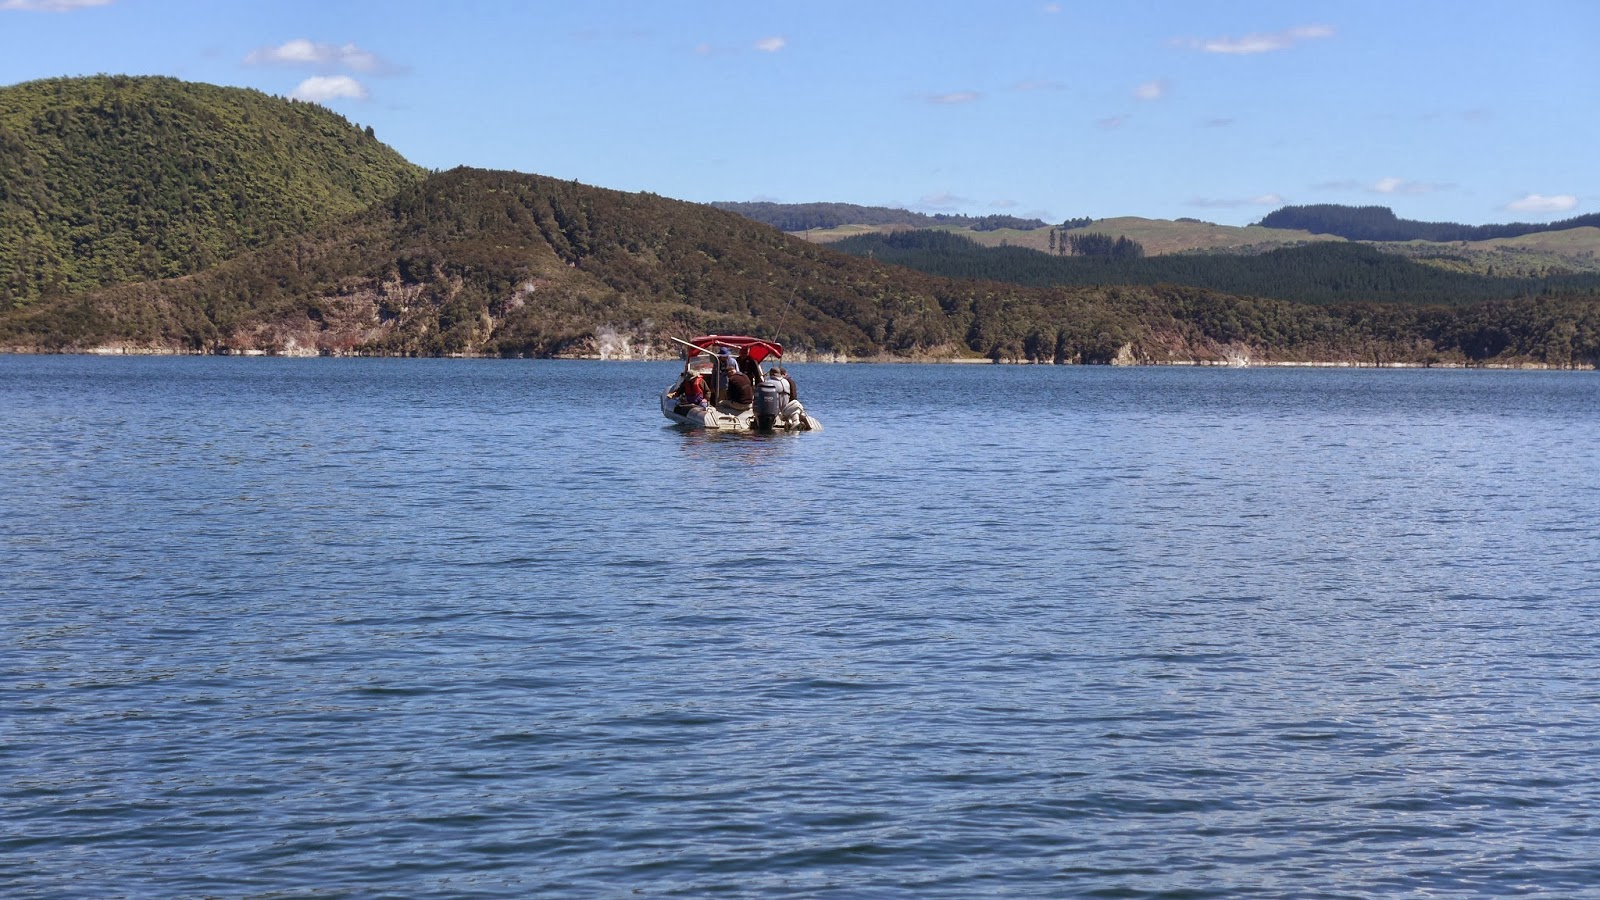
The area still has a lot of geothermal activity. One of the tasks for this expedition was to measure the heat flow coming up through the lake floor. Scientists from Woods Hole Oceanographic Institution (WHOI), the National Oceanic and Atmospheric Administration (NOAA) and the University of Waikato collaborated with the project.

Maurice Tivey of WHOI provided the special blankets for measuring heat flow in the ocean. This was the first time they had ever been used on a freshwater lake.
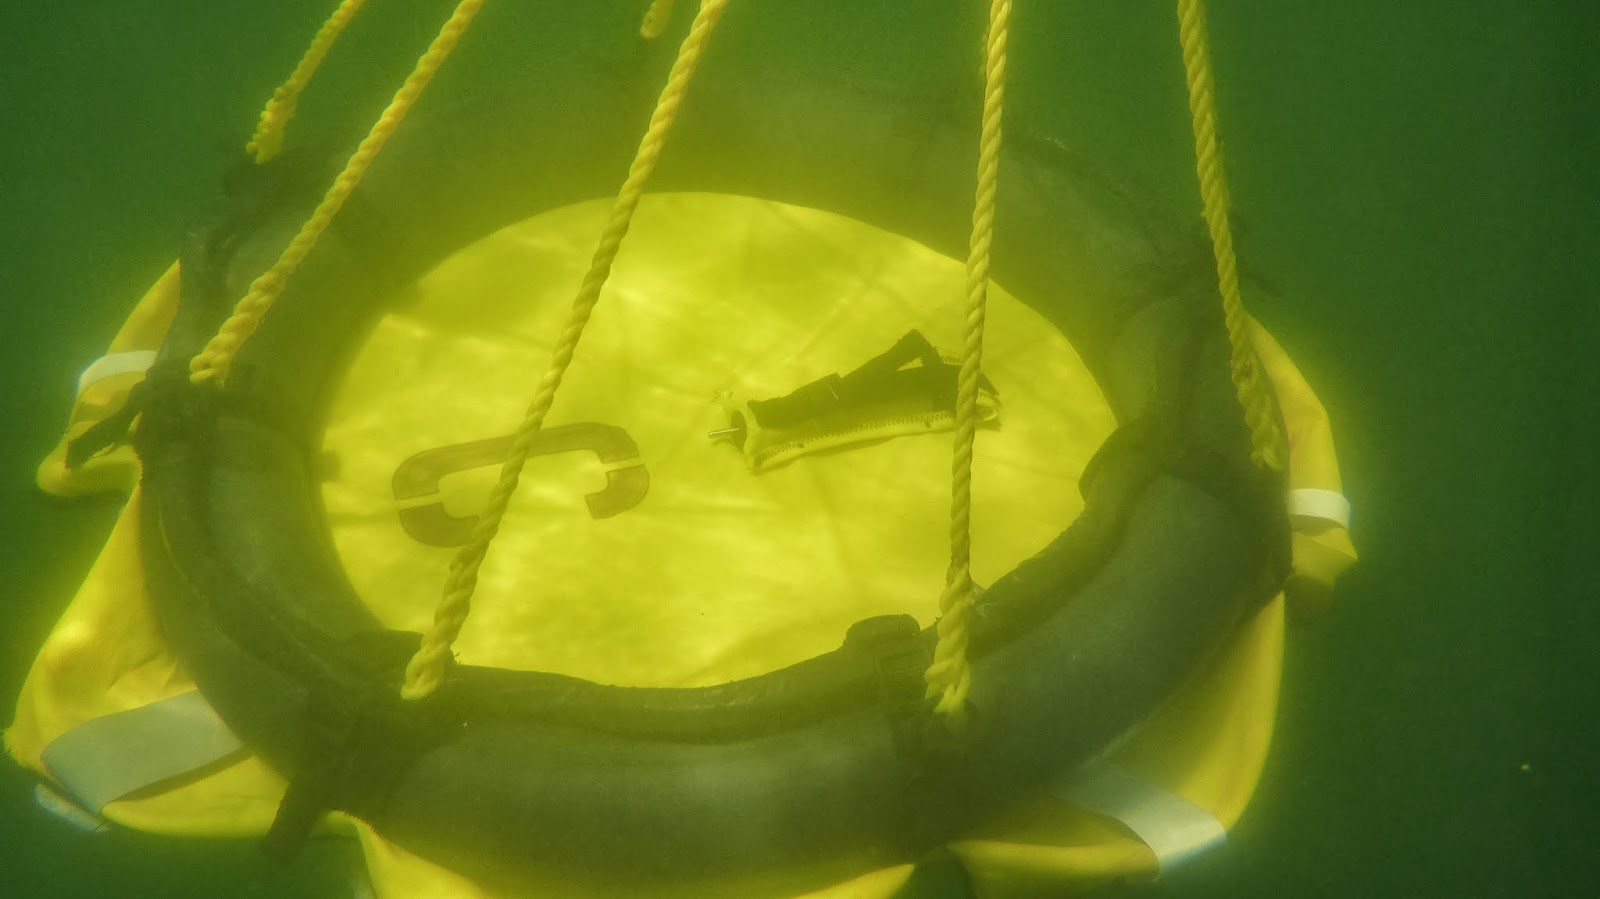
The blankets have a thermistor (thermometer) on the top and the bottom. They measure the temperature on the surface of the lake floor sediment and also of the water layer just above. The difference between the two measurements allows the amount of heat flow to be calculated in watts / square metre (w/m2).
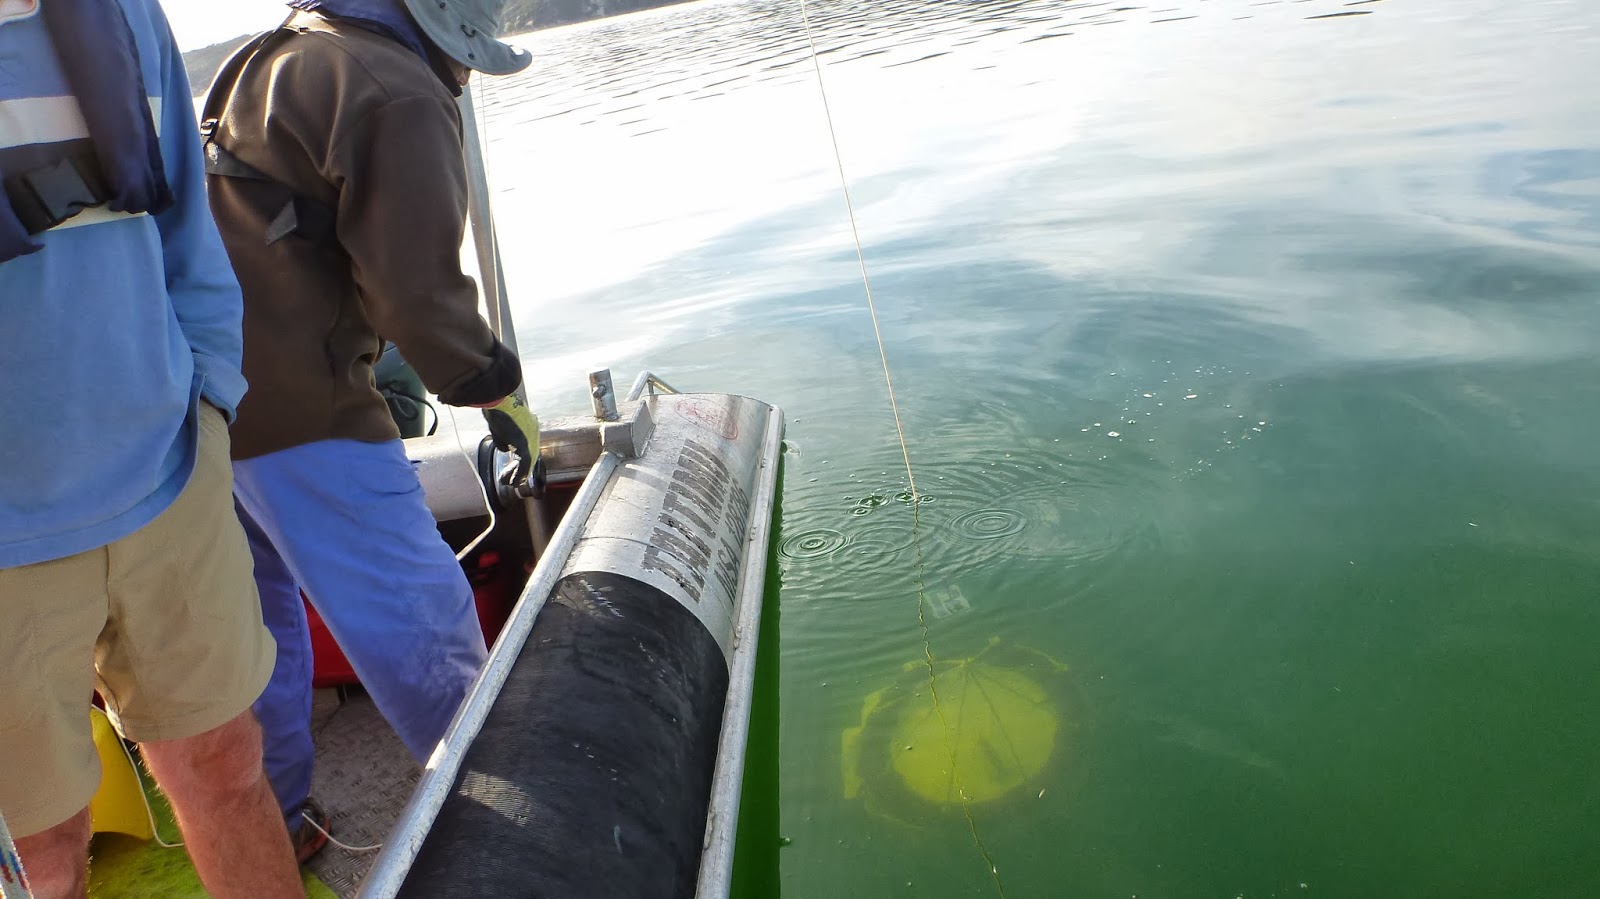
The heat blankets are lowered on to the lake floor in a pre-determined grid pattern and left for 24 hours to equilibrate with the prevailing temperatures. Then they are pulled up to the surface and re-deployed in a new position. Gradually the whole lake floor gets coverage in this way with the 10 available blankets. The thermistors take readings of the temperature every minute and store the data until they are eventually plugged in to a computer for it to be downloaded.
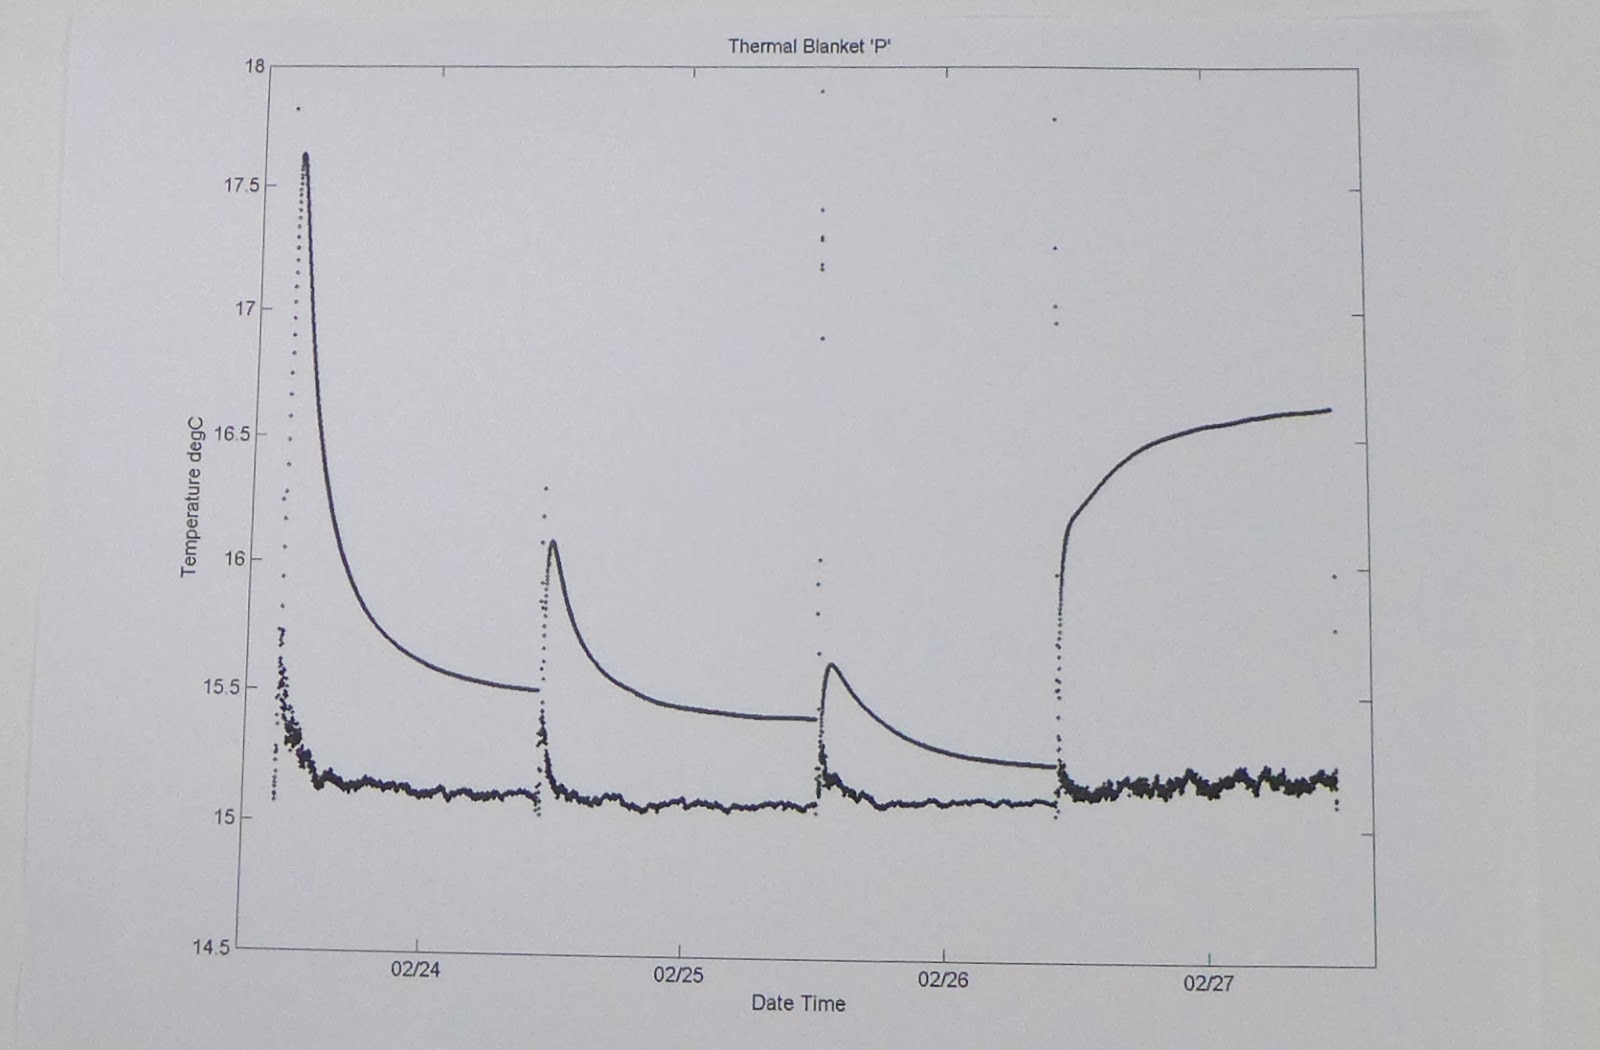
In the image you can see the temperature curves for a blanket that has been deployed at 4 different locations over 4 days. The upper curve shows the data from the lake sediment recorded by thermistor under the blanket. The lower, darker curve is the (cooler) water temperature recorded by the top thermistor. You can see that it takes several hours for the readings to adjust to the lake floor temperature conditions. The last recording on the right hand side is very hot, so the thermistor records a rising temperature.

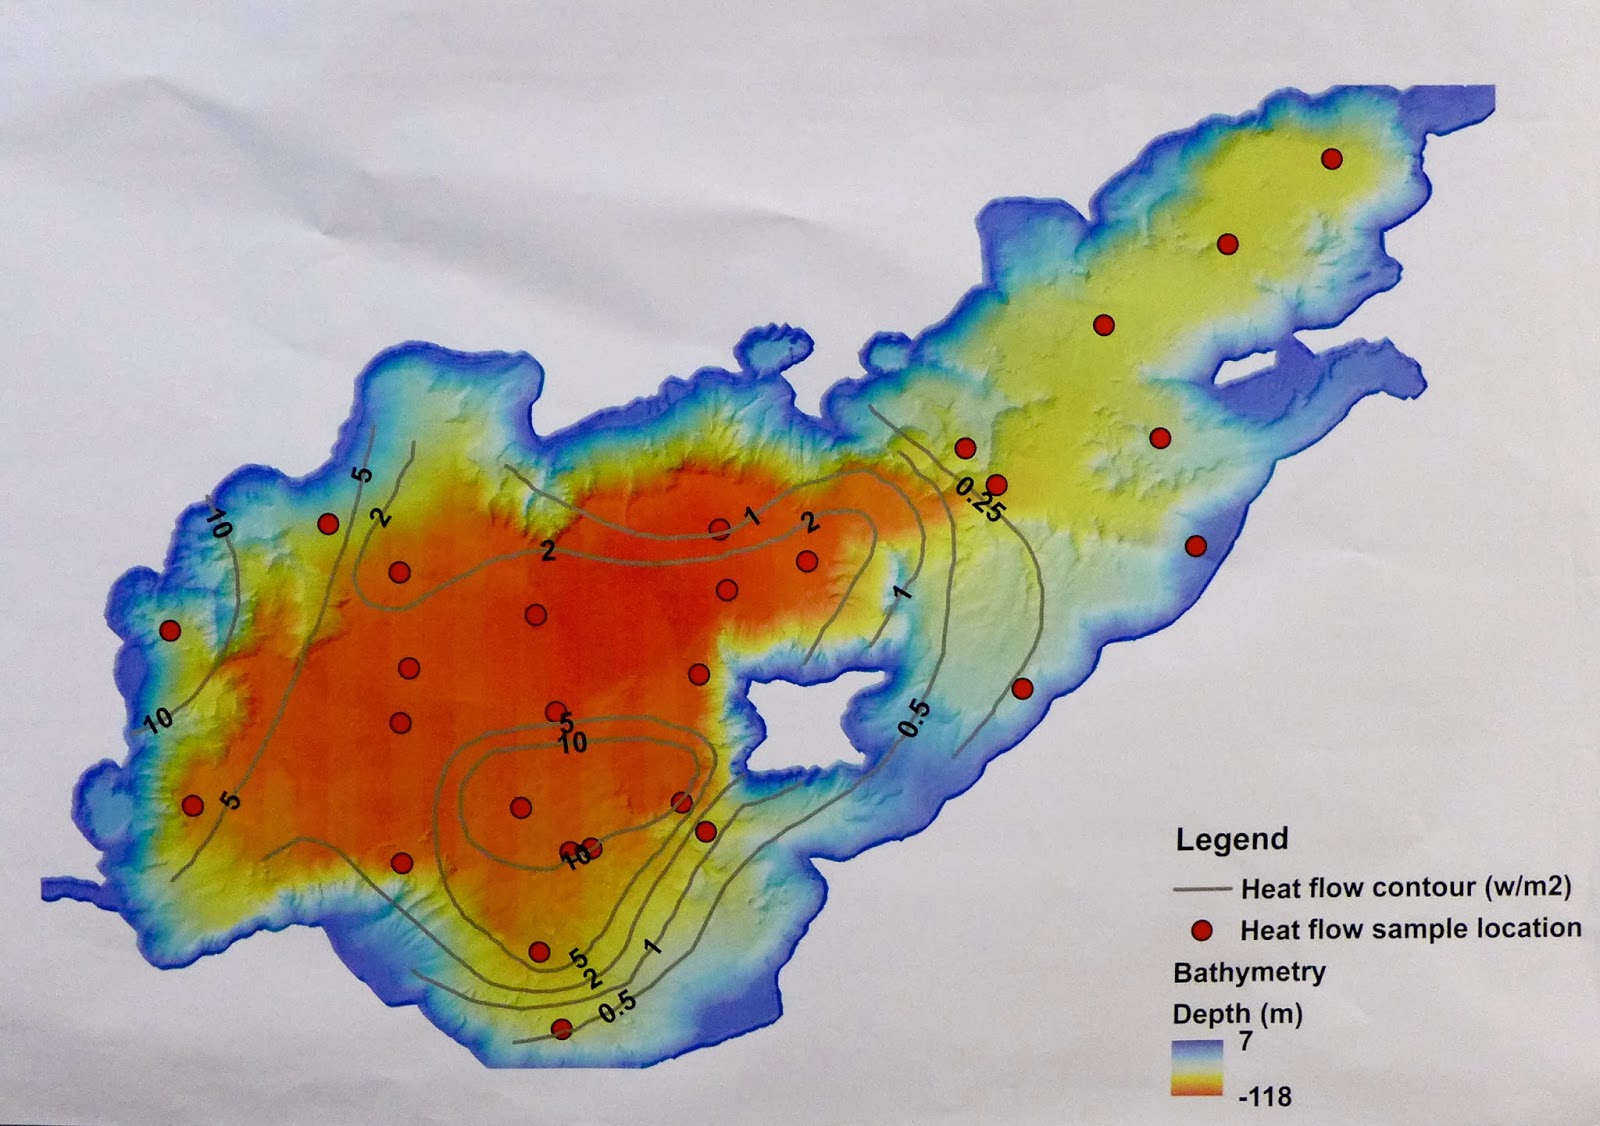
The dots on this map of Rotomahana show the locations of the measurements. Maurice has outlined the hot areas identified initially, although the data had still to be fully processed.
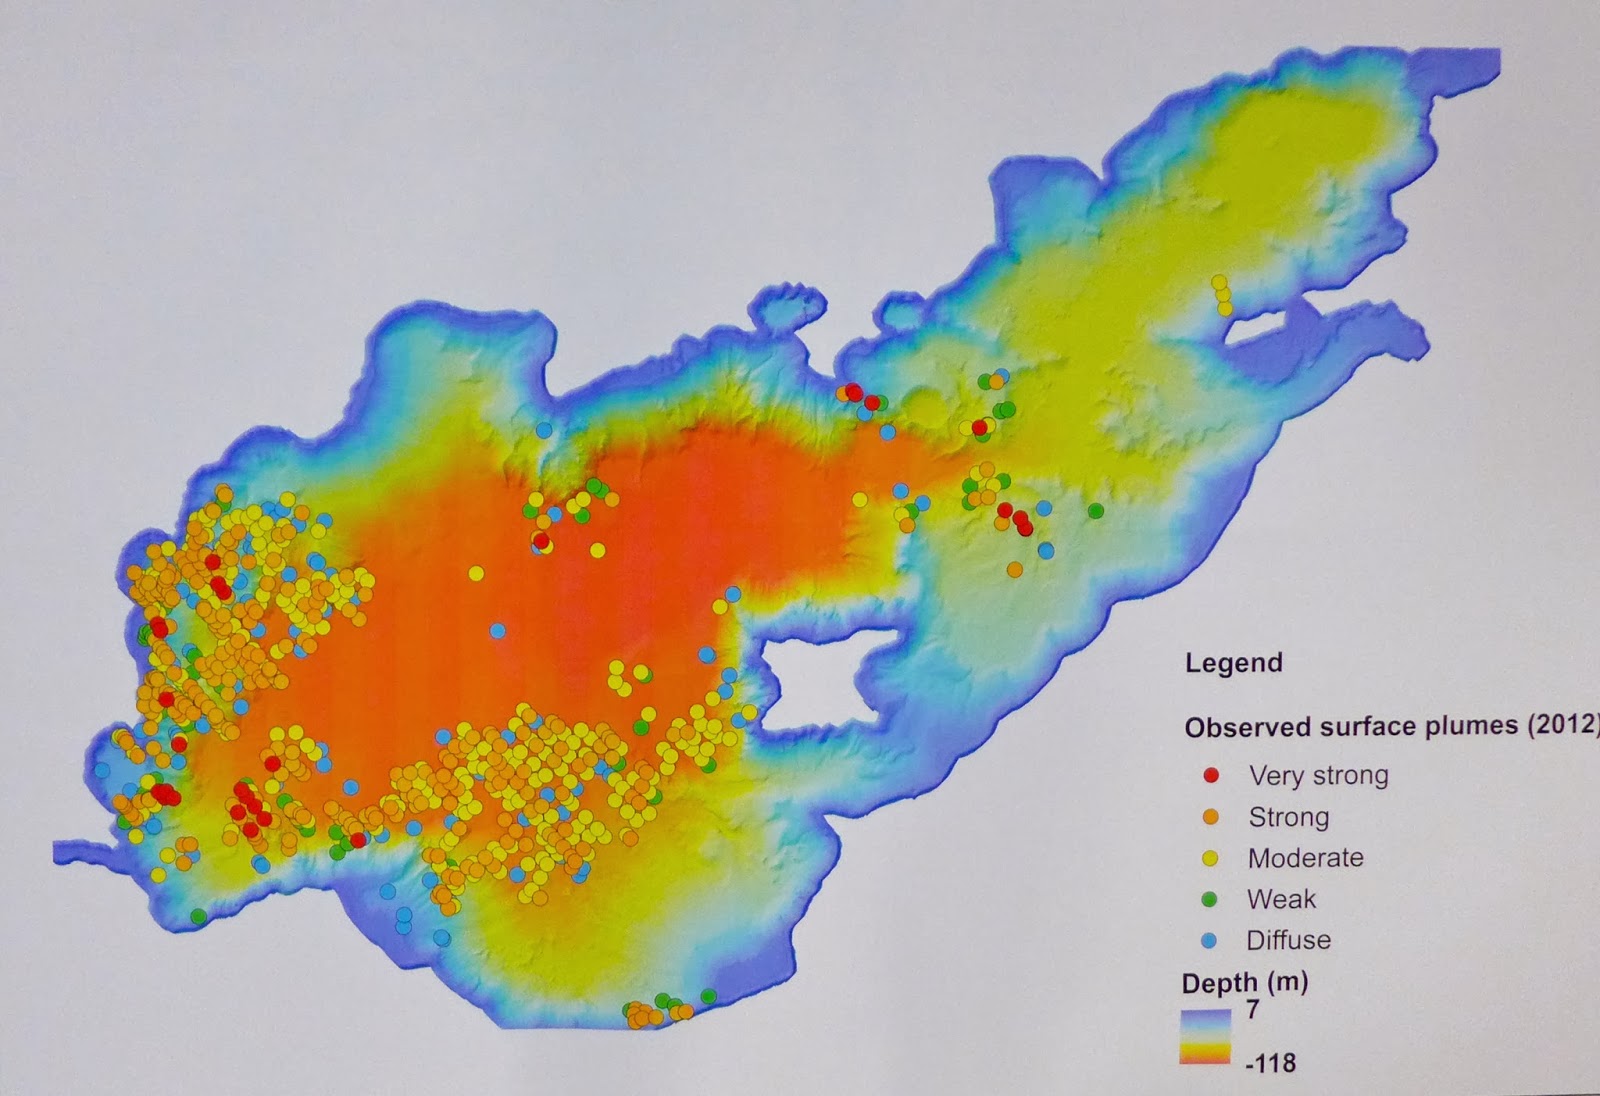
You can see how the areas of high heat flow in the map above correlate well with the map of gas bubbles recorded on the surface of the lake in 2012. This may seem obvious for a hydrothermal system, but gas plumes are not necessarily accompanied by heat.
This is a map of a heat survey that was undertaken in the 1990s. This week’s survey is more detailed and uses a new method, but it will be interesting to see how the results compare. In the earlier survey, areas of heat flow of up to 10 w/m2 were outlined. Some of Maurice’s recordings are several times hotter than these.
In this video. Maurice describes the new heat flow survey method: