

This article is about a science education project that I was involved in that was supported by MBIE’s Unlocking Curious Minds fund in 2018. It involved four three-day natural hazards science camps for intermediate level students in New Zealand’s rural Tairawhiti (Gisborne – East Cape) region. A total of 109 year 7 and 8 students and 16 teachers, from 19 schools were represented.
The science camps were based at four different locations (Gisborne, Te Karaka, Tolaga Bay and Ruatoria / Te Araroa) with the activities and field trips tailored to suit each area. The events included lots of field trips and hands-on problem solving tasks.
Here for the record is a summary of some of the activities and also a few of the places we visited:
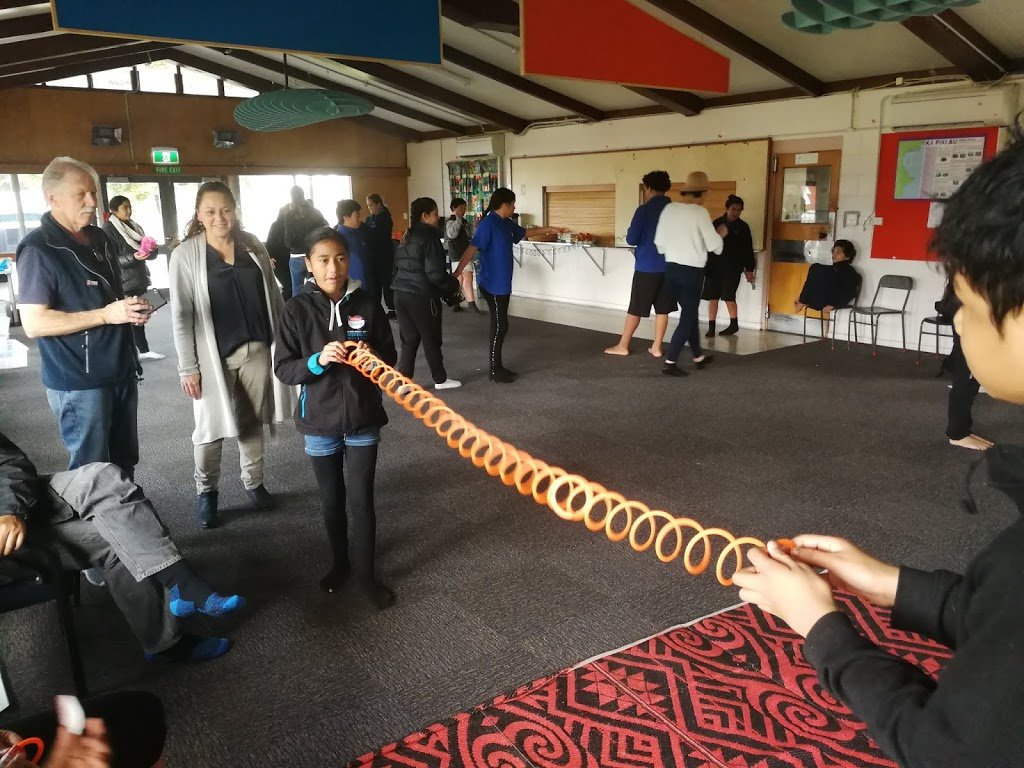
Introductory activities included observation and thinking exercises around the theme of science and natural hazards. These included demonstrations such as: earthquake P (longitudinal) and S (transverse) waves using slinky springs.
 A TC1 seismometer was used to demonstrate how ground shaking (created by participants jumping on the floor) can be captured as a wave trace on a projector screen, giving a record of the magnitude (energy) and duration of the vibrations.
The TC1 can be used by schools and individuals who wish to detect earthquakes and interact with other enthusiasts online as part of the Ru programme in New Zealand
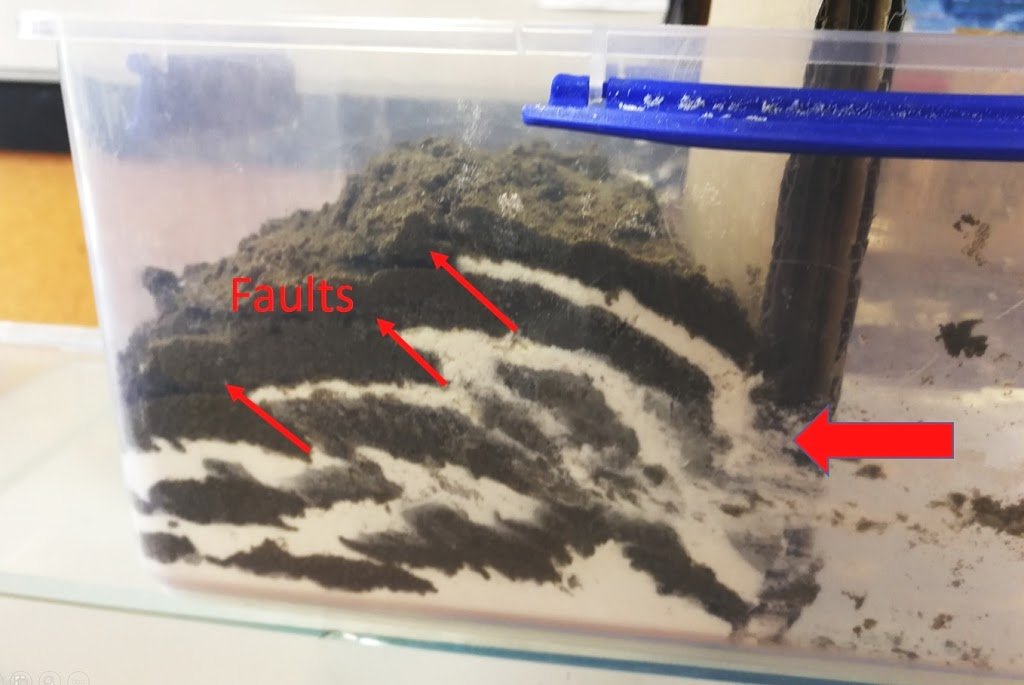
Rock deformation: Alternating layers of flour and sand in a transparent container show how rocks can be faulted and folded by compression of the earth’s crust. For information about this demonstration have a look this earthlearningidea.com page.

For a bit of a hands-on problem solving challenge, participants were invited to create some model structures to protect an area from
coastal erosion.
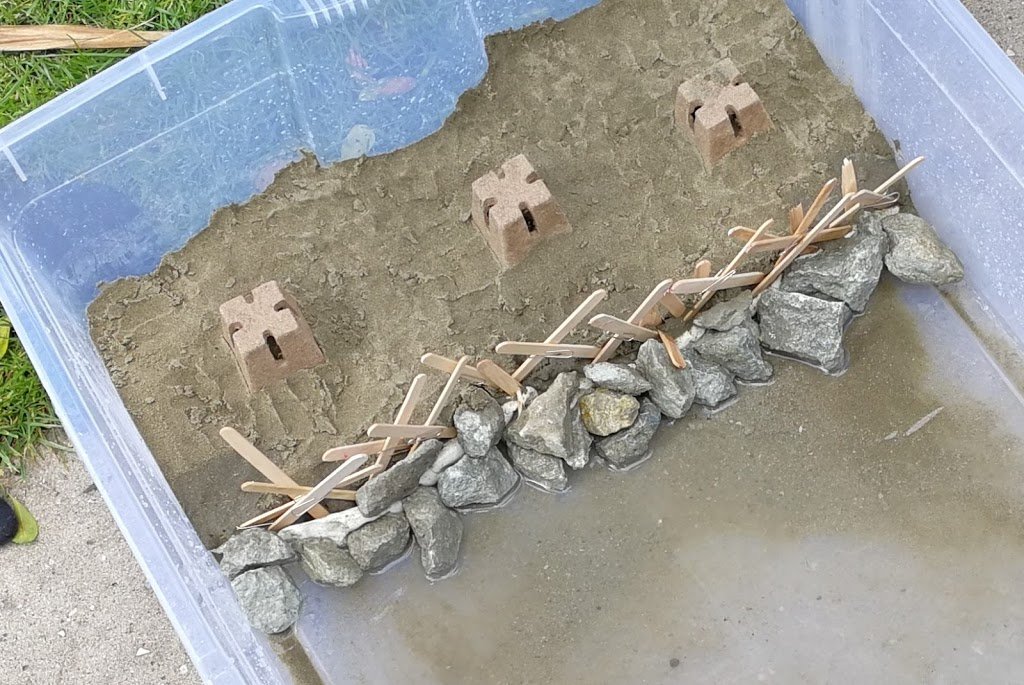
The models were set up in shallow storage containers. Once the ‘seawalls’ were built, the area behind them was backfilled with sand, the containers tilted at a shallow angle, and water added to within about 15cm of the ‘sea wall’. Here is one example:
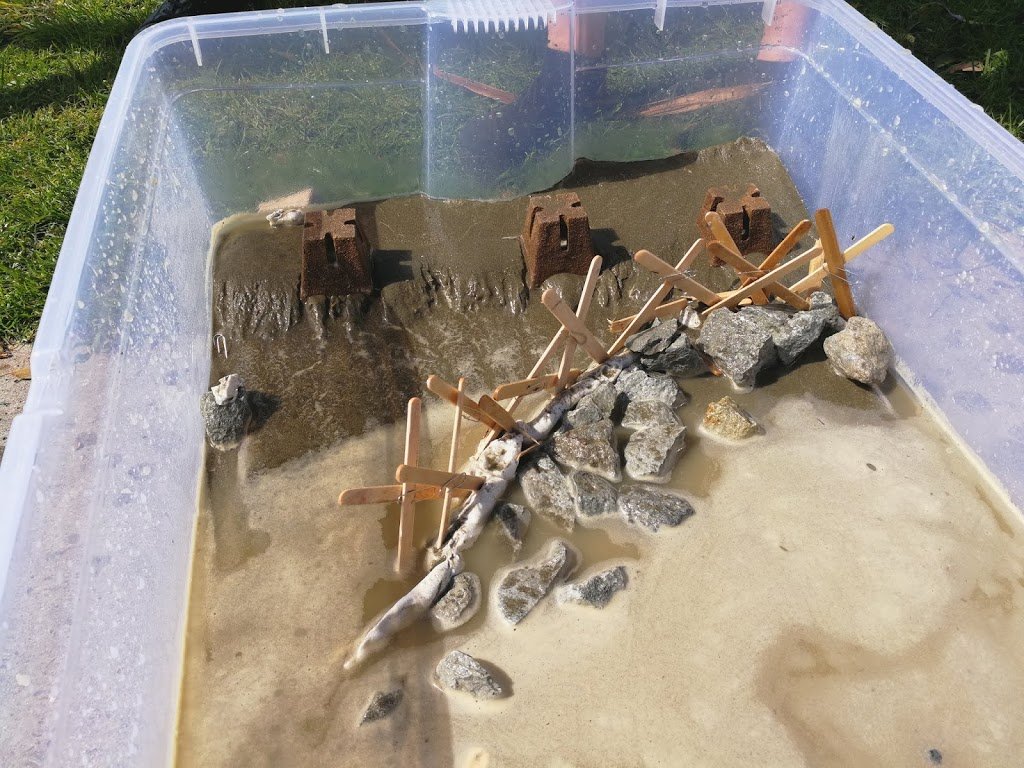
Testing involved using a plastic lid to push the water in waves up against the seawall, first gently, then with increasing energy. Different designs could then be compared and strengths and weaknesses discussed.

Following this exercise we travelled to Wainui Beach, Gisborne where there has been a variety of attempts to protect the foredunes which have properties built on them.

Interestingly, many of the methods that had been used were similar to those that the students thought of with their model making. Here you can see the remains of a concrete wall that has been undermined by wave erosion

Another similar model making exercise, this time including a slope of cardboard at one end, was to design rockfall barriers. These were also tested to destruction using varying quantities and sizes of rocks rolled down the slope.
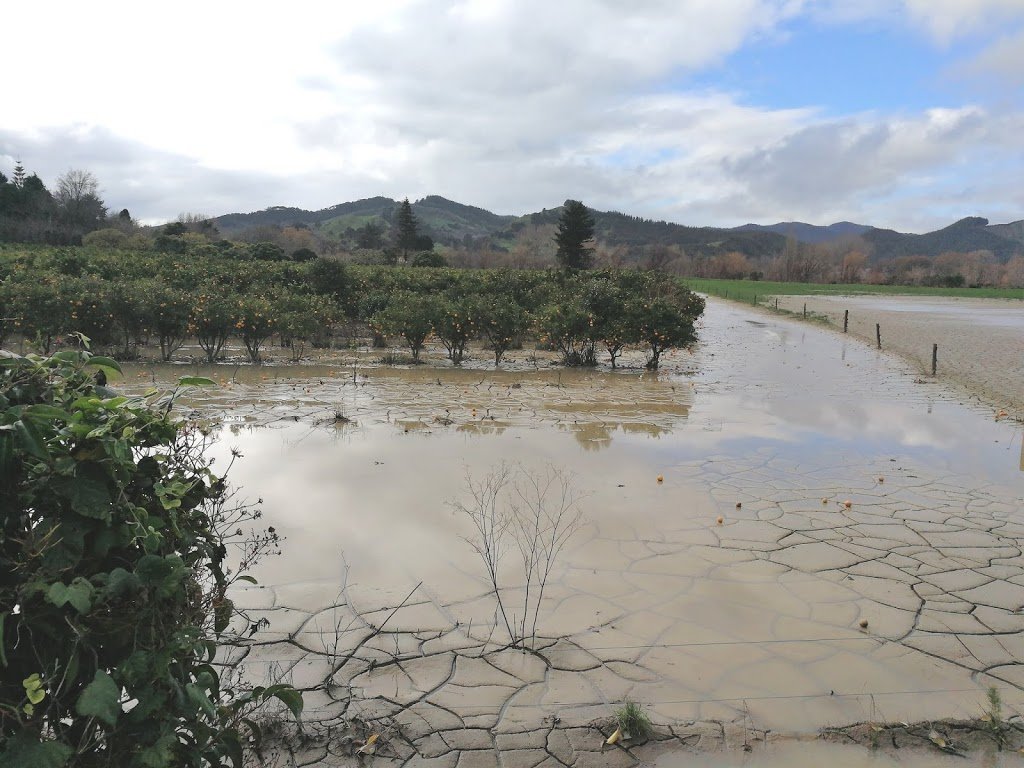
We were also able to do another activity associated with flooding which has been a big issue this year in the Gisborne area.The photo shows the sediment covering some of the farmland near Te Karaka following the floods.
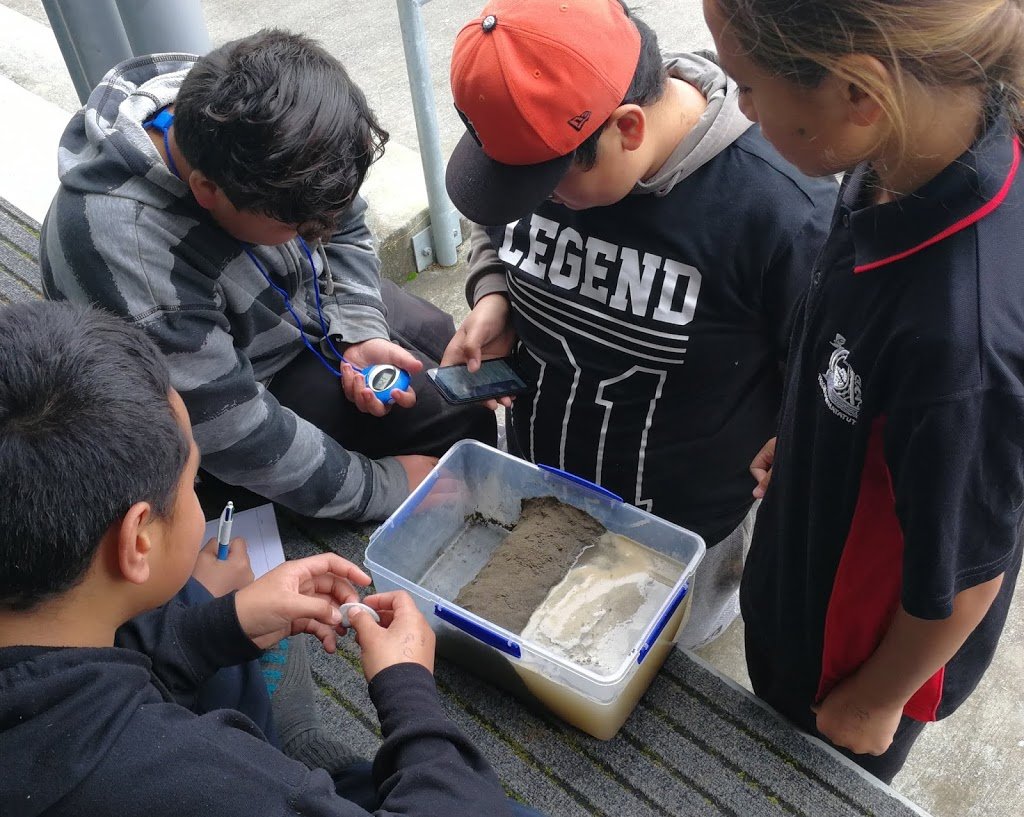
For this activity, participants had to design a stop-bank, and test how long it could retain water, by recording any pooling of water on the ‘dry’ side , every 30 seconds.
If you are an educator wanting information sheets to run these activities they can be found on the GNS Science website learning pages here.

Here are some of the field locations that we visited, and what we investigated at them:
At Pouawa Beach, north of Gisborne, we made careful drawings of some deposits that are thought to have been laid down by a tsunami. Shells in these layers have been radiocarbon dated at about 2000 years old. The layers include gravel and shells that would have been transported from the sea floor.

Using a drone we could get a good view the top of a marine terrace (the flat surface upper left of pic) at the north end of the beach. The terrace was formed at sea level as a wave-cut platform during the last interglacial (about 80 thousand years ago), and has been uplifted since its formation by tectonic activity. There is a wide shore platform which you can see just covered by water in the photo. Another great example is nearby at Tatapouri – for more information check out the GeoTrip here – these surfaces will also be uplifted eventually to form another step in the landscape.
These marine terraces show that earthquakes and tsunamis have a long history on the East Coast!
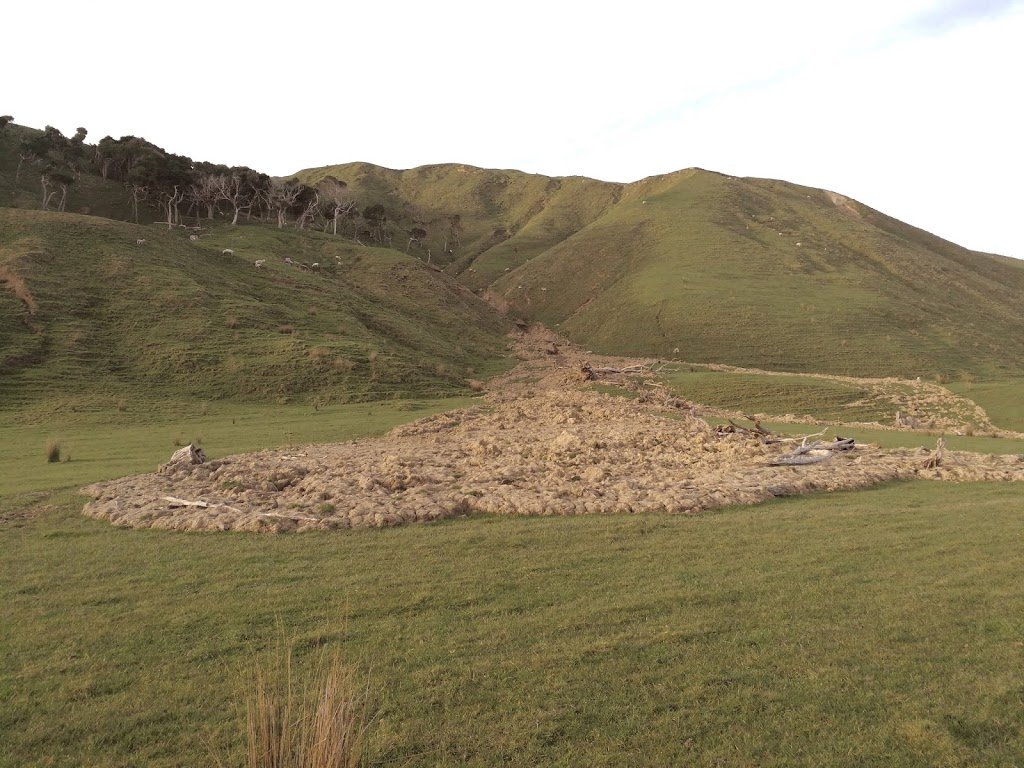
At the north end of the beach. we passed a landslide that had occurred during the very wet weather in June 2018. From the ground we could see the toe of the slip which included tree trunks, boulders and lots of muddy sediment.
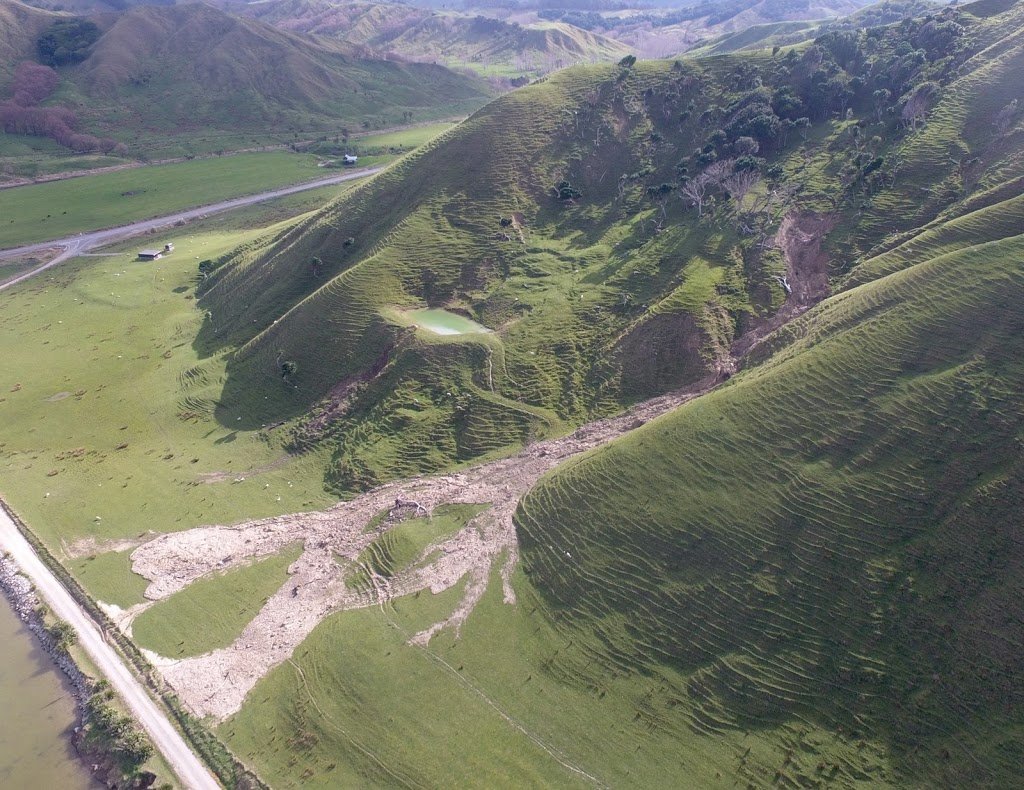
With our drone, we were able to get a much more complete view of the slip, including the source area, which was not visible from where we were standing. This shows clearly the value of drone technology as a tool to extend our view of this active landscape:
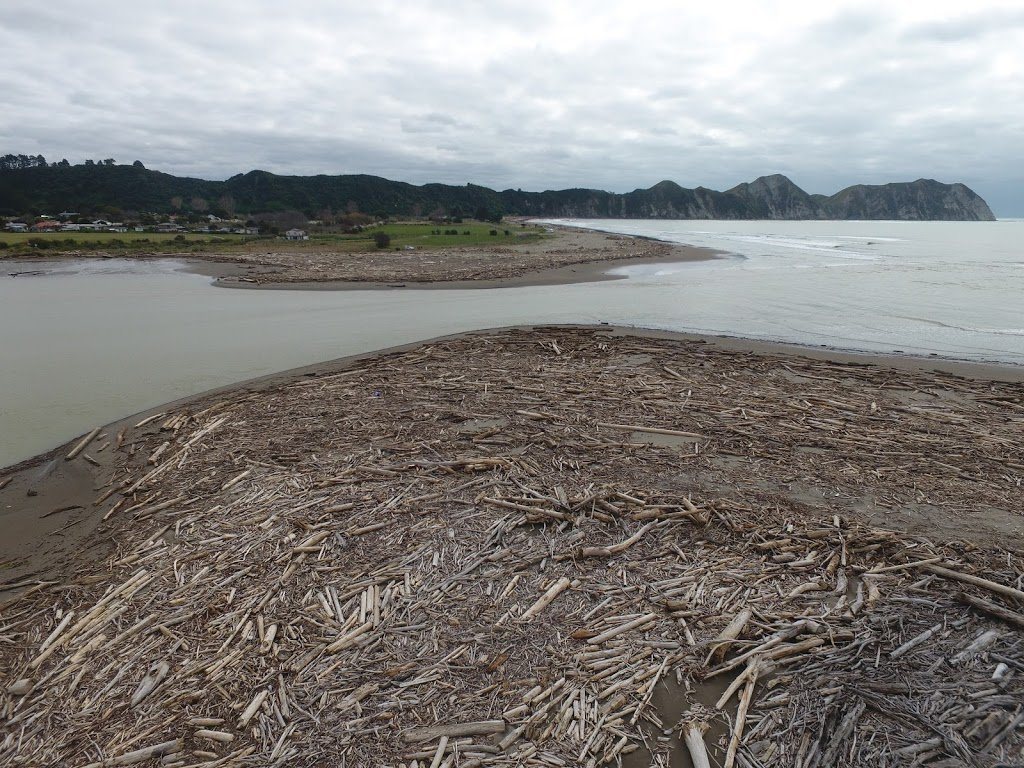
Next stop Tolaga Bay, where the beach has been covered by logs, brought down from the forestry plantations by the recent heavy rainfall. The logs caused a lot of damage to properties, bridges and land as they travelled down the flooded rivers.

Here we spent some time analysing the types of logs scattered on the beach, by counting the different species (pine, poplar, willow or other) within 10m square quadrats. The results showed that by far the majority came from pine forestry.

We were able to visit a forestry area inland of Tolaga Bay, which showed that following harvesting of the pine trees, there is a period of time where the land is vulnerable to erosion before the next generation forest grows large enough to stabilise the soil. Following clear-felling, the slash (abandoned logs and branches) can get washed into rivers during heavy rainfall.

Further North still we did a day trip to the Tapuaeroa River where a number of features of the landscape and geology were investigated. The sediments in a river can tell you about the geology of the catchment area, and also a lot about landscape change.
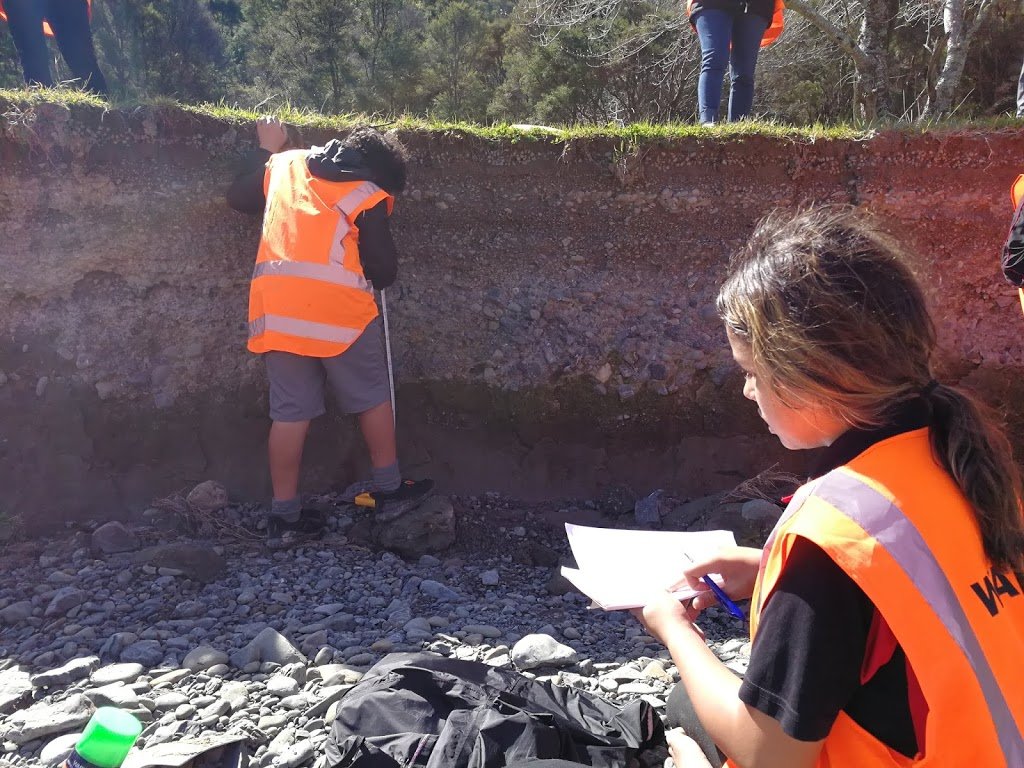
By carefully recording the different layers, we were able to deduce a possible history for the area.

The soil layer at the base included wooden roots and branches, representing the original forest ecosystem. At the top of the soil we found a buried fencepost – indicating farming activity, and presumable forest clearing. Above that the gravel and landslide deposits show faster erosion probably due to the reduction in forest cover. Finally the downcutting by the river to produce the cliff section shows reduced sedimentation, related to the planting of pine forestry..
 |
| Mt Hikurangi |
The small river cutting contained a microcosm of changes that had affected the wider landscape going back to pre-european times. This image shows Mt Hikurangi in centre left, with the Tapuaeroa river beyond, leading to the broad Waiapu River in the further distance.
If you have got this far, I hope the article has been useful to give you ideas for how you can bring the science of Natural Hazards into the classroom in ways that get those students to ask questions, explore and come up with ideas and discoveries of their own.
Kia Ora, This learning experience looks amazing. Please can you let me know if you will be doing any other camps like this. I am particularly interested in those targeting the yrs 9-11 in the Heretaunga/Wairoa regions. Nga mihi, Mandy