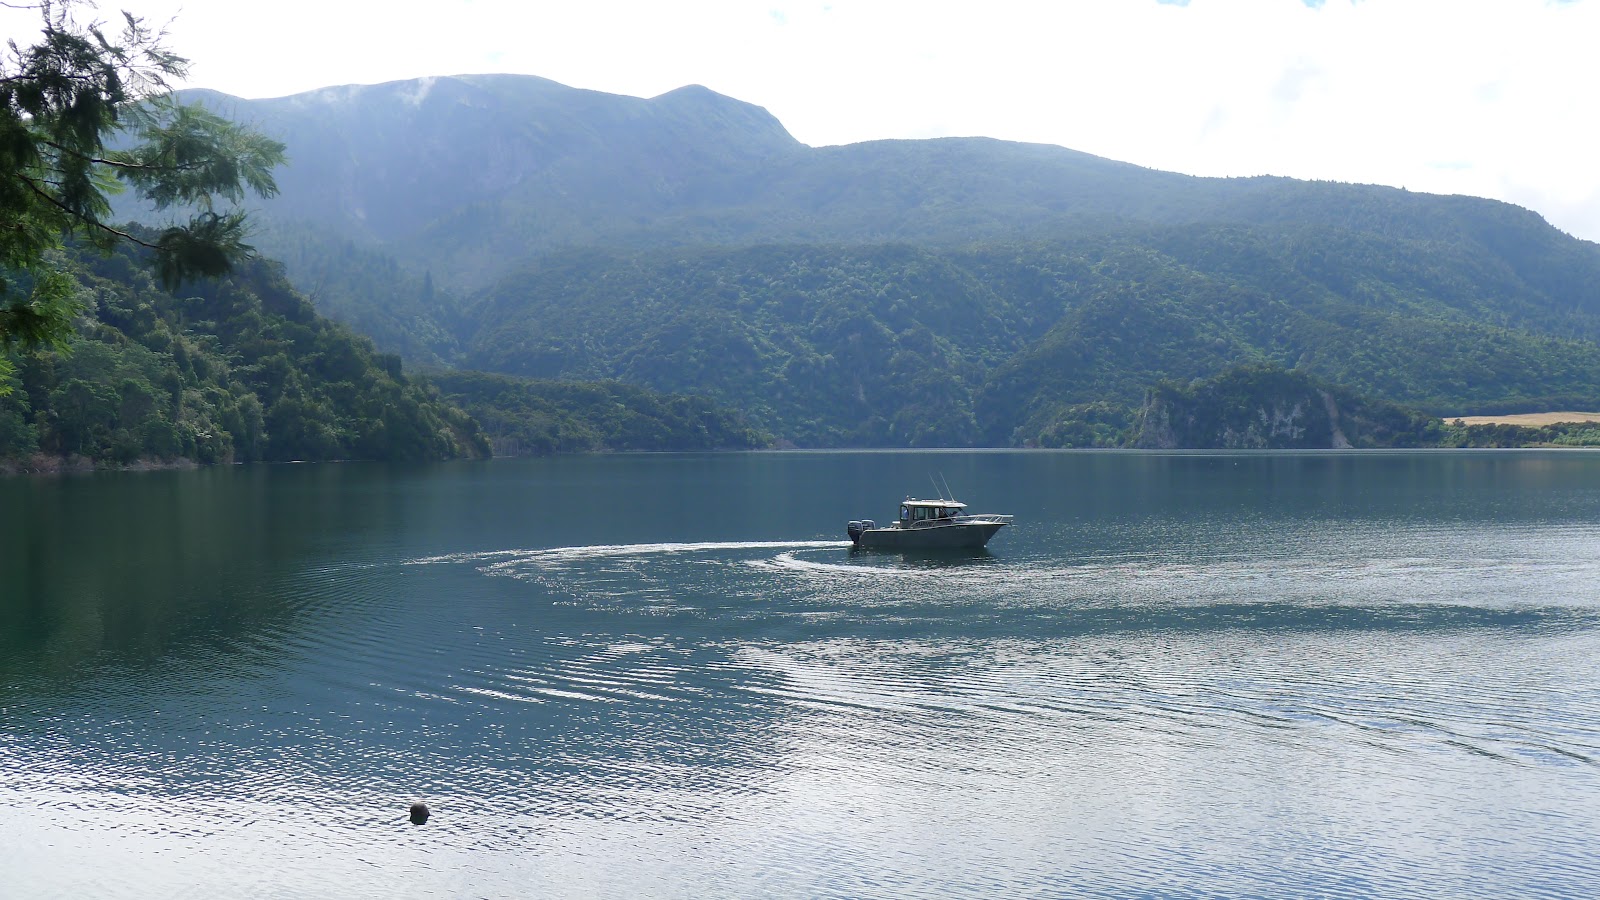
This week I am revisiting Lake Rotomahana with Cornel de Ronde and two surveyors from IXSurvey, Mark Matthews and Dave Mundy. Our first goal in this year’s research at the lake is to make the most detailed map possible of the lake floor. Next week we will use this detailed map to help us take a closer look at the areas of the Pink and White Terraces using seismic survey techniques. The mapping survey will also give us a great deal more information about the hydrothermal activity underlying large parts of the lake.
Last year, our improved map of the time helped us to identify the comma shaped submerged landform that led us to the remnants of the Pink Terraces. This year we are using a multibeam sonar scanner that is improving our map resolution by at least ten times. We have been witnessing the gradual revelation of fascinating details of the lake floor that shed additional light on the violence of the 1886 Tarawera Eruption and its aftermath.

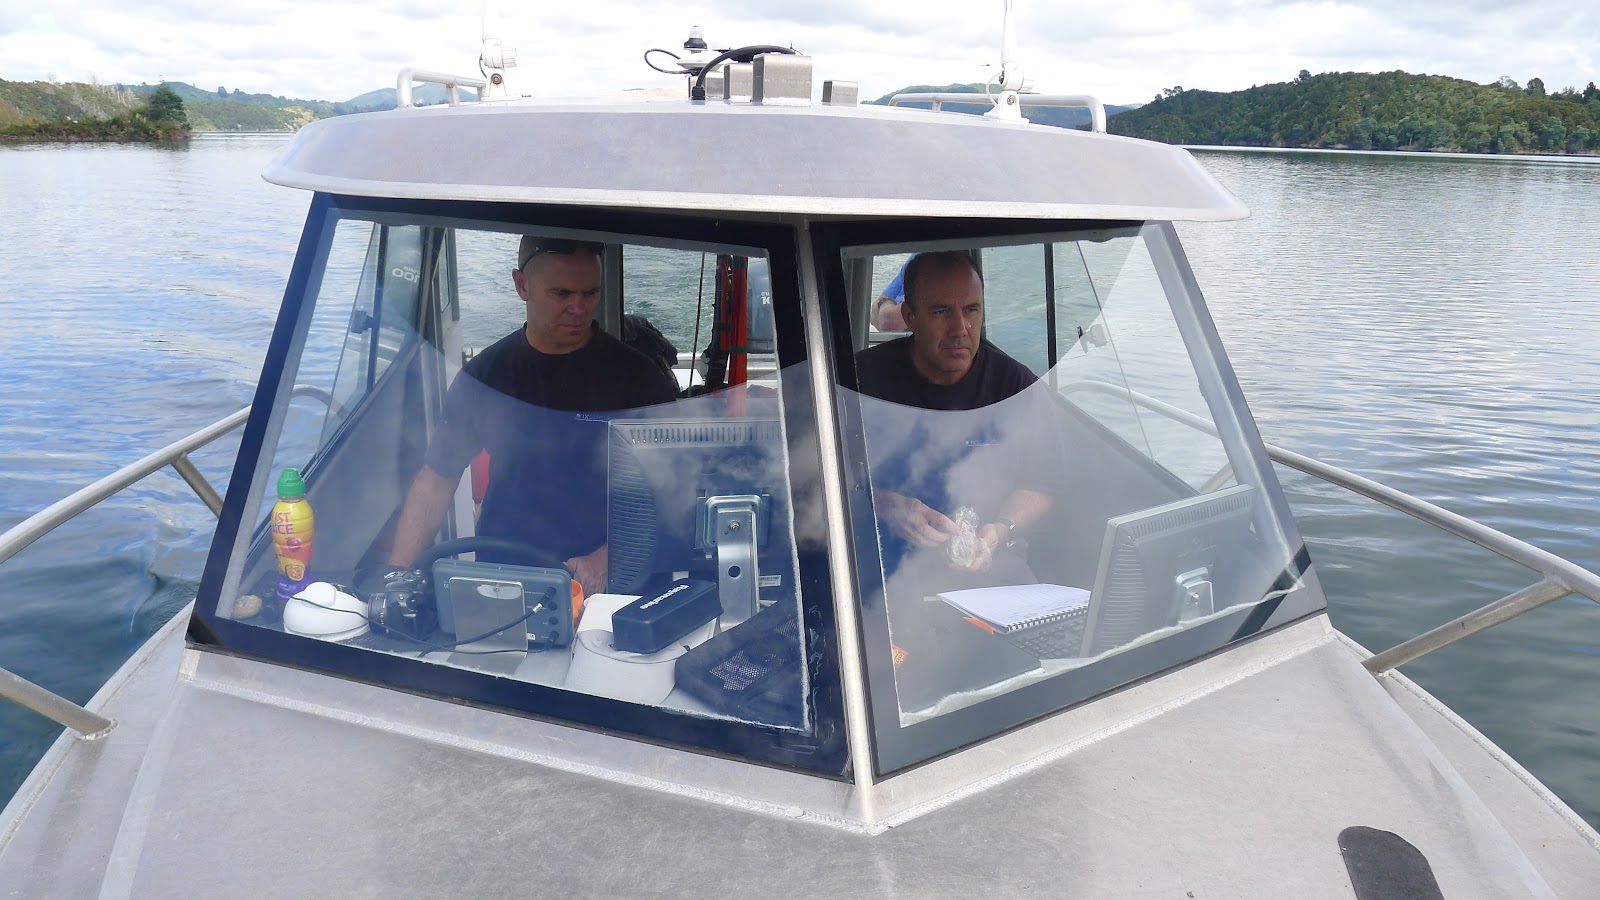
The scanner is housed below the centre of the small motorboat. As we travel over the surface of the lake, sound waves are beamed out in a line downwards and out to each side. The time taken for the soundwaves to return to the on-board sensors from each direction is translated by the computer into a bathymetric map of the lake floor. The initial, ‘uncleaned’ map shows up in realtime on the onboard computer screen, with colours representing different depths from red (shallow) through to yellow, green and blue as the depth increases. In this image, you can see that the boat is mapping a submerged crater at the edge of the lake.

As we criss cross the lake, the map appears as if it is being gradually ‘painted’ on the screen. Where the lake is shallow, the width of the scan is narrow, perhaps ten or twenty metres, whereas in the deeper areas it can extend to about 100 metres on each side. It is amazing to be able to watch the lake floor appear in crisp detail before ones eyes, showing many features that were created by the 1886 eruption and then hidden below the water for over a hundred years.

There are numerous explosion craters, mudslides, ridges, depressions and pock marked gas vents. Vast streams of bubbles are also picked up by the scanner, showing that the lake floor is still actively fizzing. Many of the deeper gas bubbles dissolve in the water column as they rise up, but in some places they vigorously break out at the surface as you can see in the photo.
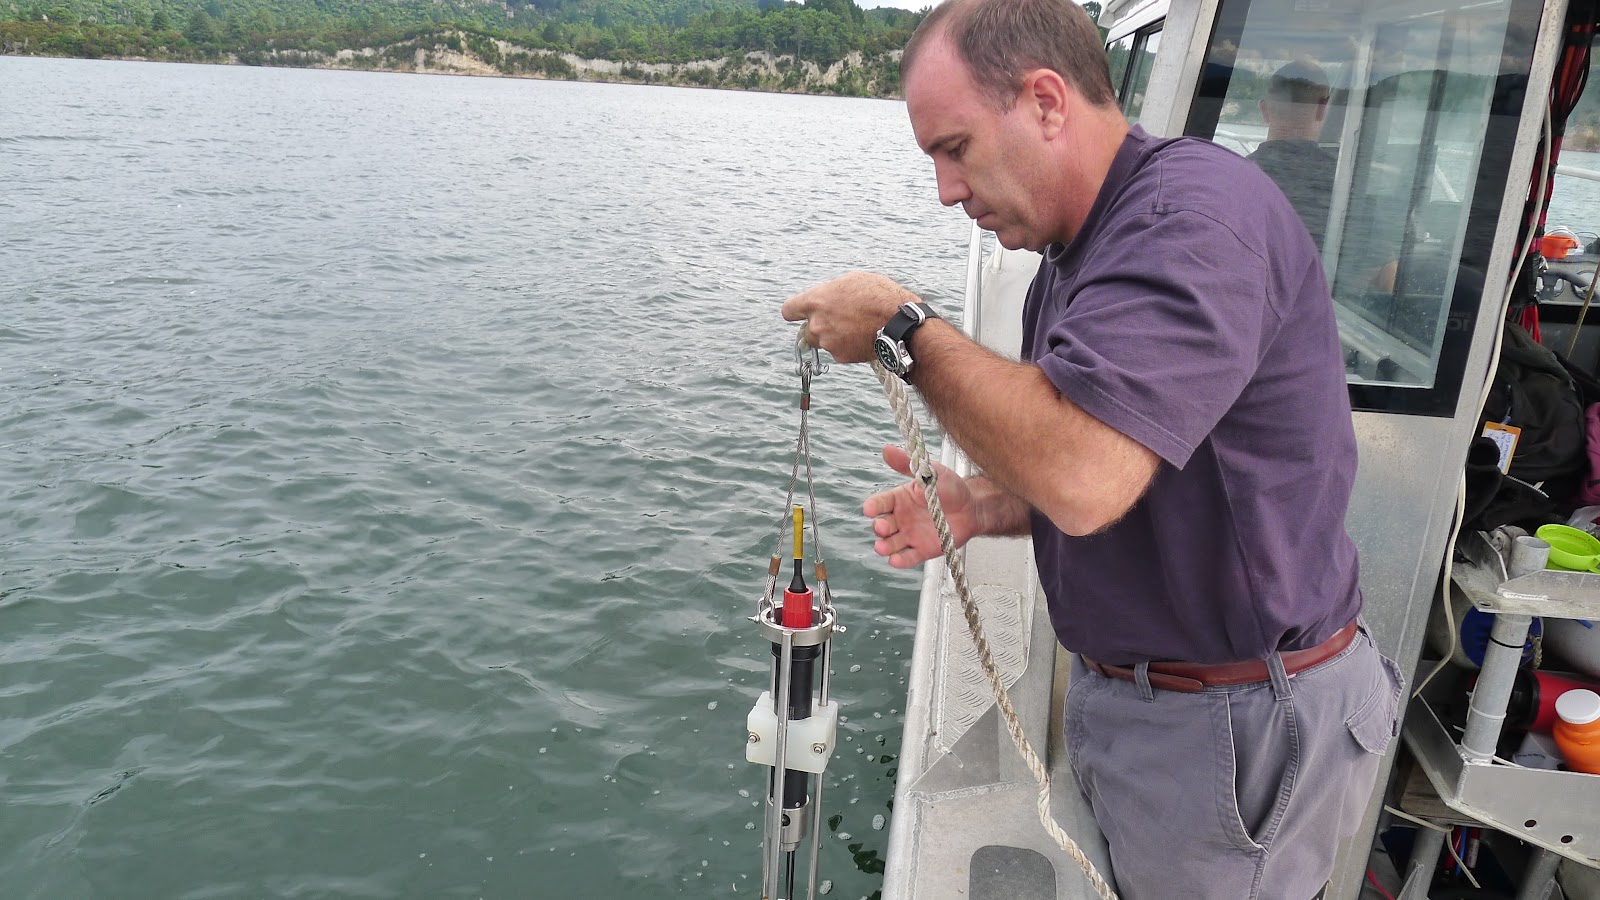
Here Mark is putting a sound velocity probe into the water to calibrate the sonar survey. The sound velocity depends on the water density, which varies with temperature and dissolved minerals. This is important because the velocity of the sound waves affects the calculation of distances and depths.
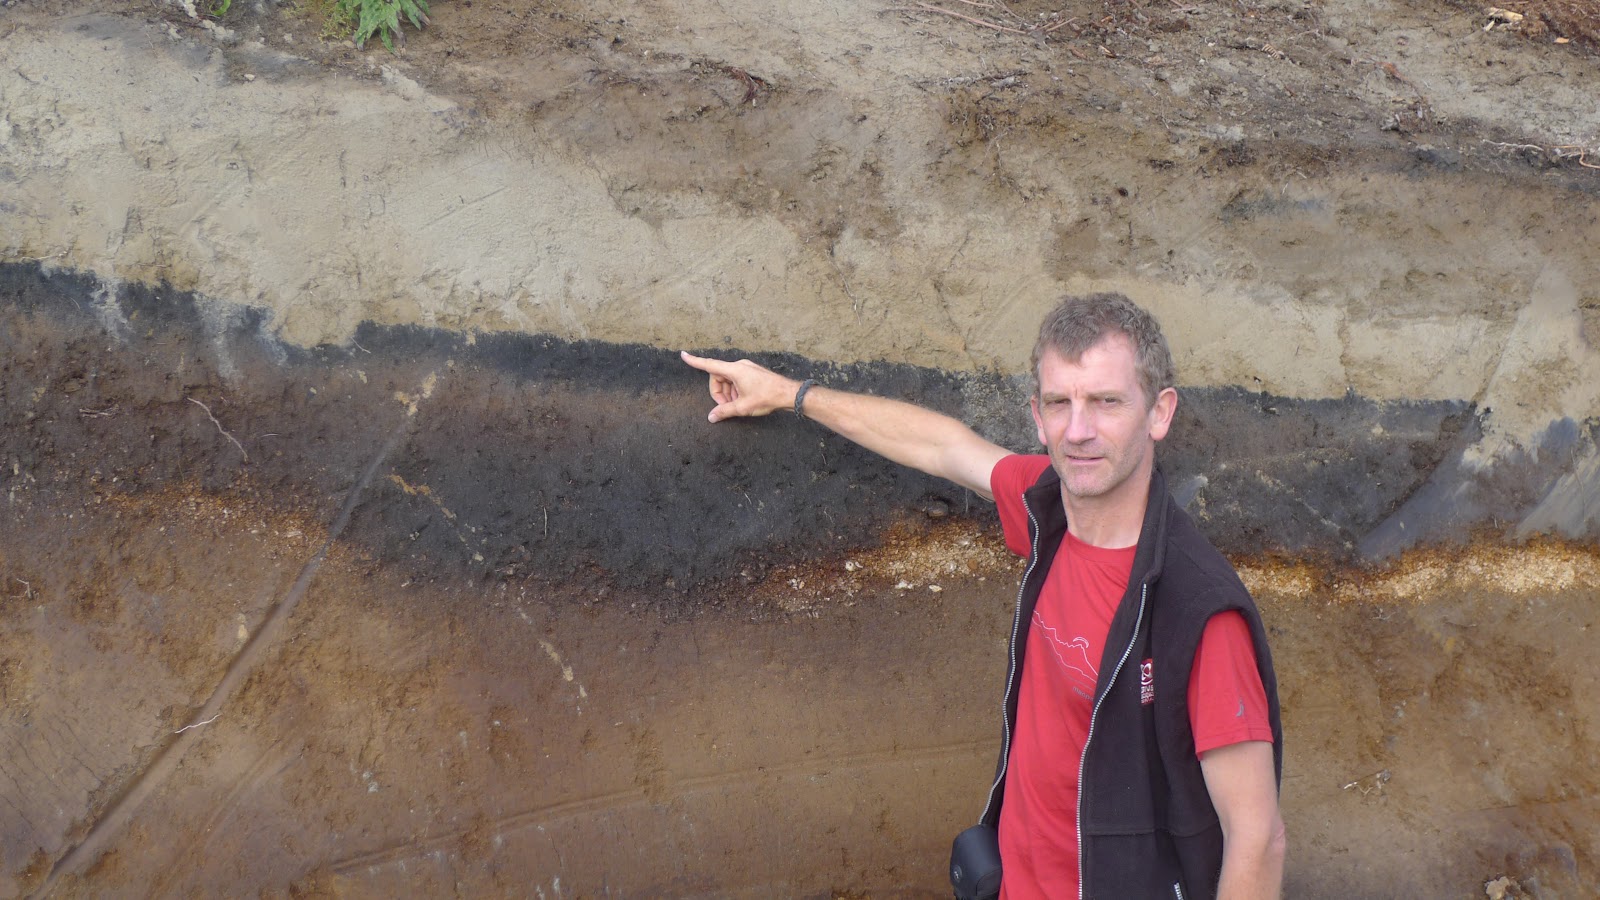
Just beside the access road to Lake Rotomahana there is a unique geological horizon. The dark line in this freshly excavated roadside outcrop represents the ground surface up to the day before the Tarawera Eruption, ie June 9th 1886. Above the dark line is the mass of erupted pumice known as the Rotomahana Mud that covered the landscape from the early morning on June 10th. A single, dramatic day in time represented in the geological record around Lake Rotomahana!
Our investigations next week will attempt to answer the question as to whether the ‘Eighth Wonder of the Natural World’, the Pink and White Terraces still lie largely intact under the mud just like the dark soil horizon, or whether the exposed portions we located last year are all that is left.
another awsomely cool post