Having had a close up look to the surface trace of the Wairarapa Fault (see recent post here), I thought it would be interesting to find out the latest about what such a major geological structure looks like below the earth’s surface.
Stuart Henrys and colleagues at Victoria University, the University of Tokyo, Japan, and the University of Southern California, USA, have been busy working on the results of the SAHKE project that ran a large scale seismic survey across the Lower North Island in 2011. The purpose of this survey was to gain a better understanding of the anatomy of the plate boundary and associated structures below the Lower North Island.

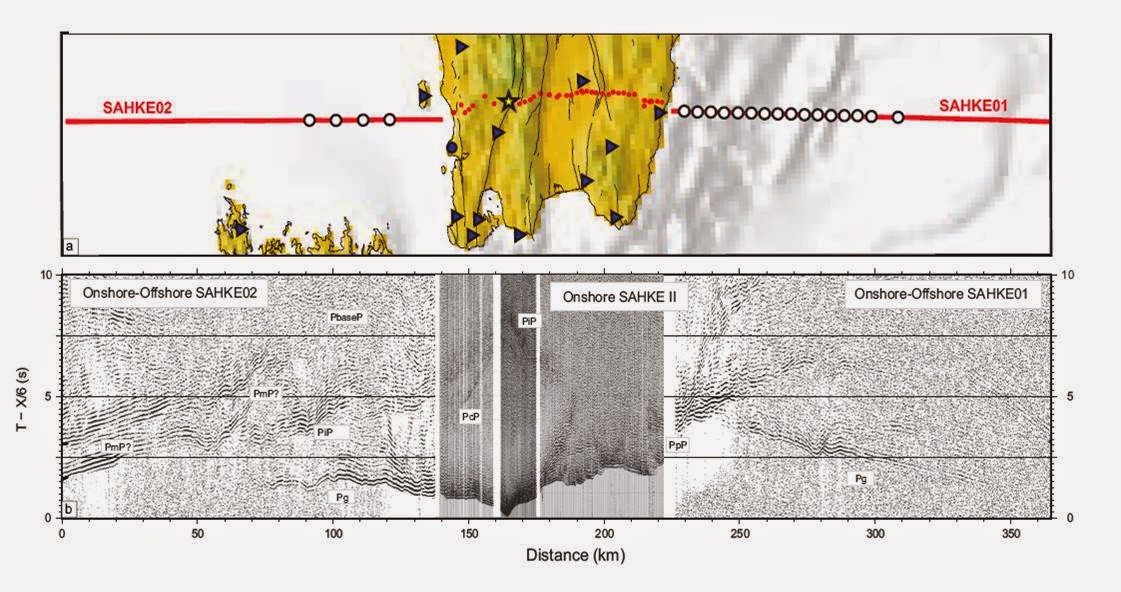
This image shows the line of the survey that not only ran across the land surface, but also extended across the sea floor to West and East. Thousands of measurements were recorded, creating a huge dataset that had to be processed to create two dimensional seismic cross sections.
 |
| SAHKE seismic survey. Stuart Henrys @GNS Science |
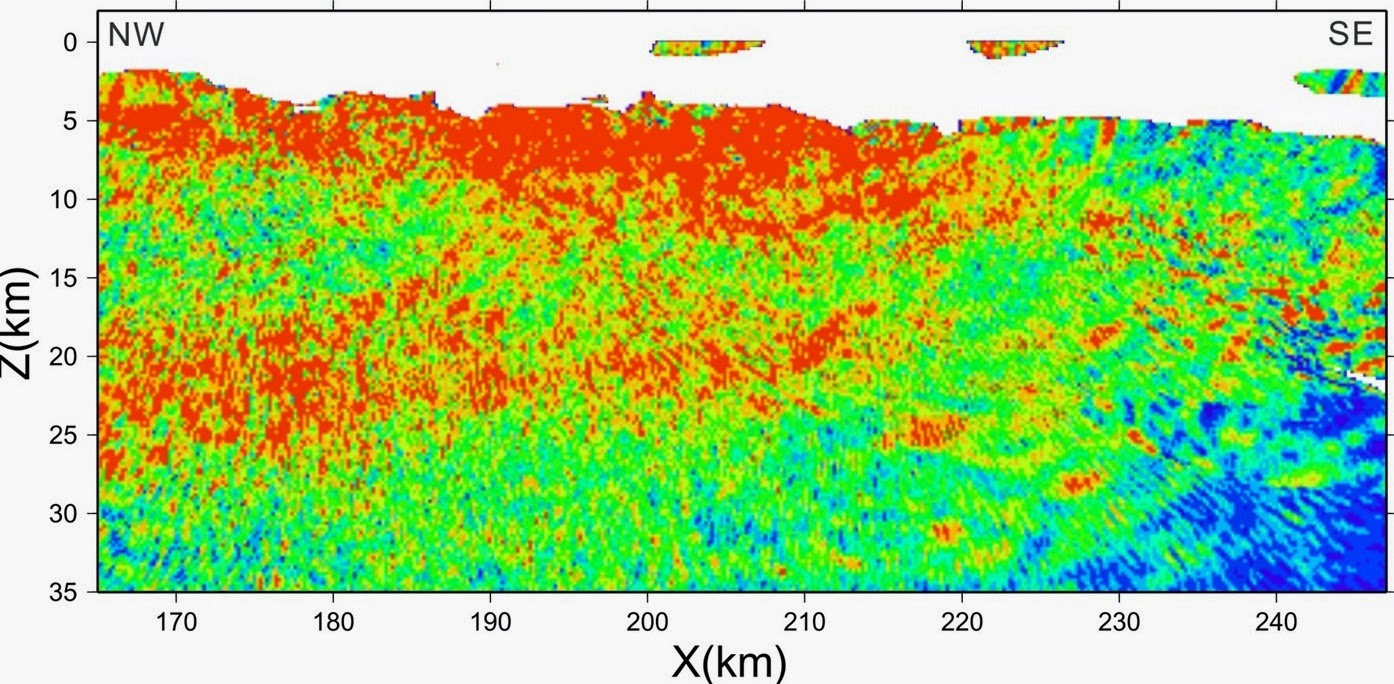
Here is an example of how about 80 kilometres of the section can be displayed to highlight some of the structures in the crust down to 35 kilometres depth
 |
| SAHKE seismic survey. Stuart Henrys @GNS Science |
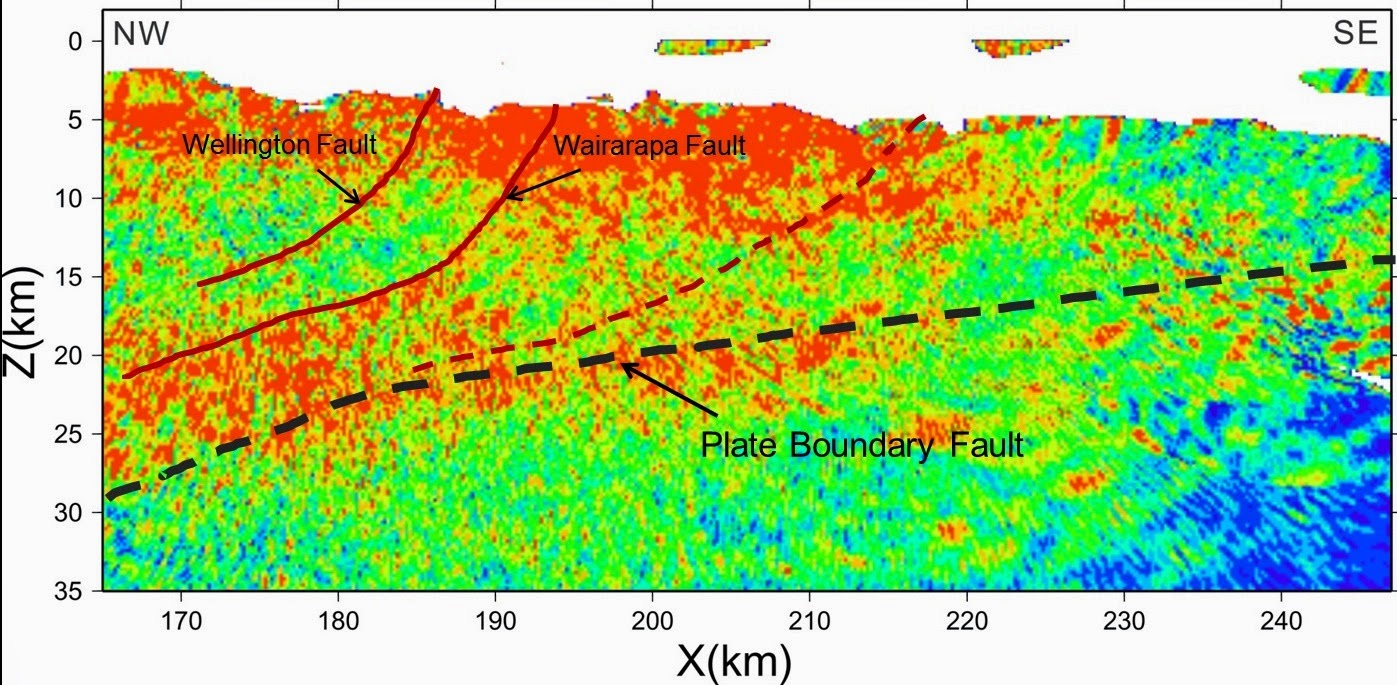
It takes a lot of work to be able to interpret the information to see some of the major structures. You can see that a coherent band of energy deeper than 20 km depth is interpreted to be the plate boundary and descends at a very shallow angle, Also how the Wairarapa and Wellington Faults show up as narrow bands of energy that become low angle thrusts from about 15 kilometres below the surface
 |
| Stuart Henrys @GNS Science |
This is a simplified summary of the complete 250 km length of the SAHKE seismic survey:
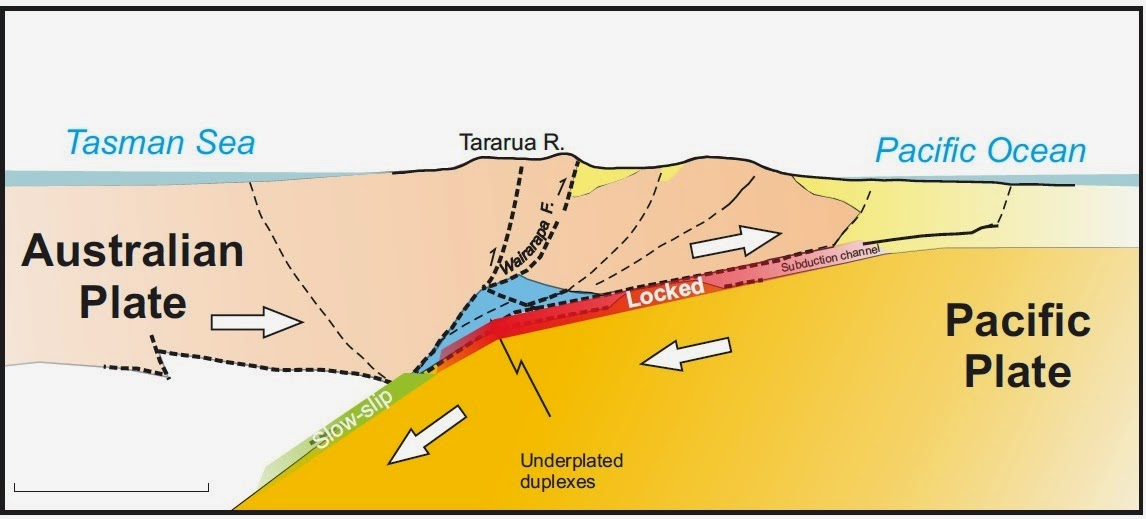
Initially the plate boundary dips at a very shallow angle below the Lower North Island. This angle steepens below the west coast (Kapiti). The blue area is rock that has been scraped off the surface of the Pacific Plate and stuck (“underplated”) onto the base of the Australian Plate. You can think of the Australian Plate acting a bit like a chisel as it scrapes the top off the Pacific Plate in this way, pushing the overlying crust upwards along the Wellington and Wairarapa Faults to give rise to the Rimutaka and Tararua Ranges.
The diagram also shows (in red) where the plate interface is locked (down to about 30 kilometres depth) and the (green) area where it produces slow slip events. Find out more about the potential for very large earthquakes to be generated on Wellington’s Stuck Plate Boundary and also about Slow Slip Events.
 |
| Tararua Range, J.Thomson@GNS Science |
The narrow, long form of the mountains of the Lower North Island may be related to their position above where the plate boundary dives more steeply downwards with underplated sediments pushing the ranges up.
 |
| Cross section of SAHKE seismic survey. Stuart Henrys @GNS Science |
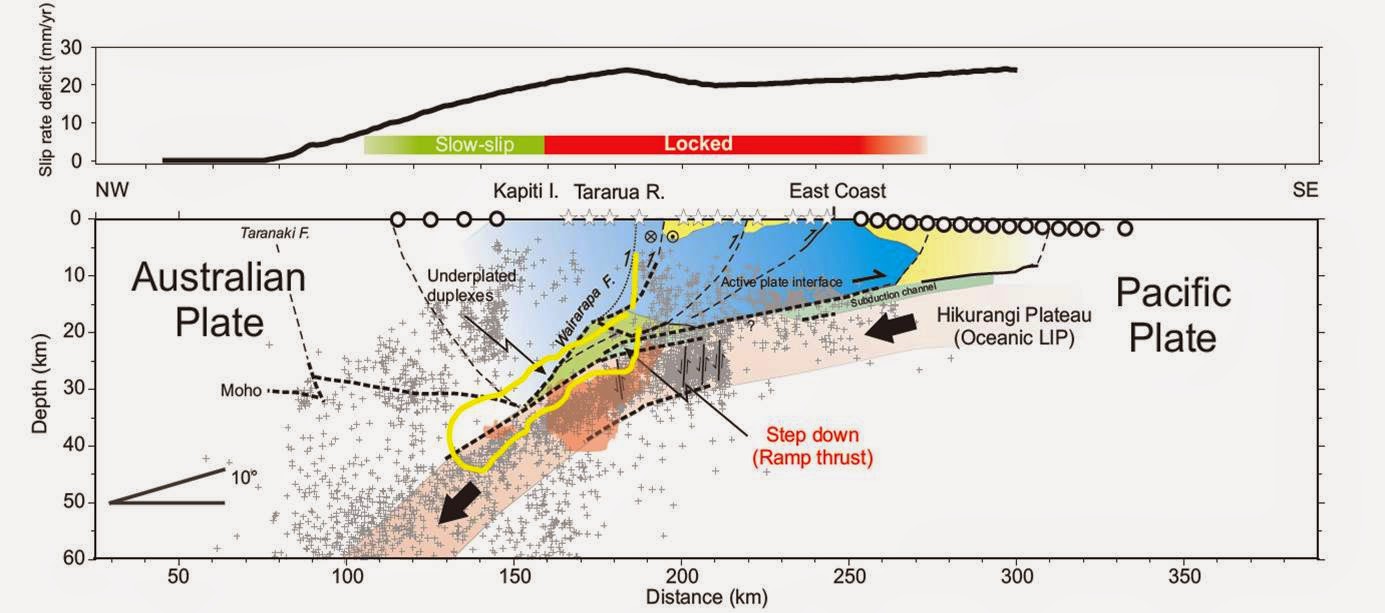
Here is a more detailed image for you to explore if you are interested, showing some examples of earthquake locations (grey dots) in relationship to the crustal structures:

UPDATE 5th Feb 2015:
Have a look at this media release about further groundbreaking discoveries resulting from this research project – “Scientists discover slippery base on underside of Pacific Plate”
It’s so interesting to learn about the seismic interactions taking place under the area. It always amazes me at how far geology has come compared to before.