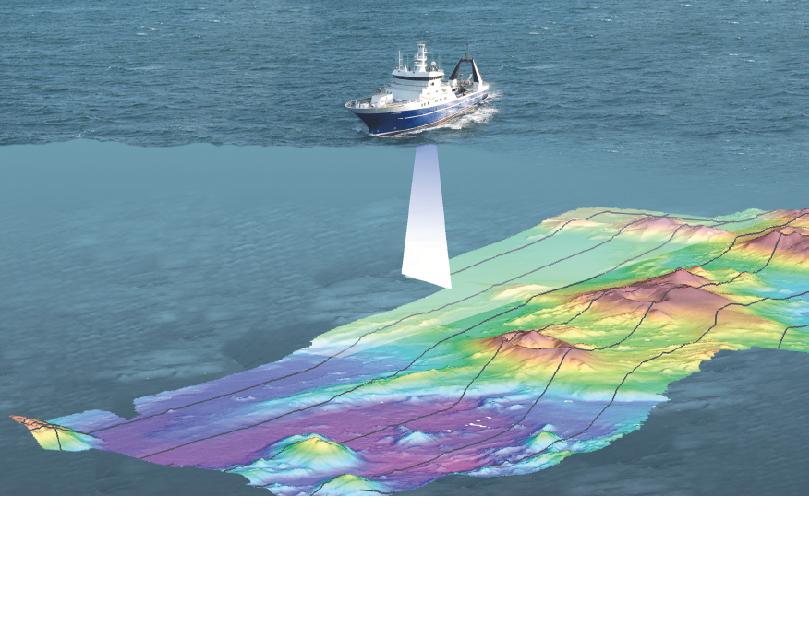
 One of the amazing tools that is on the Tangaroa is a multibeam sonar scanner that maps the contours of the sea bed as the ship travels along. It sends high pitch sound waves downwards in a fan shape and calculates the shape of the sea floor from the complex acoustic reflections.
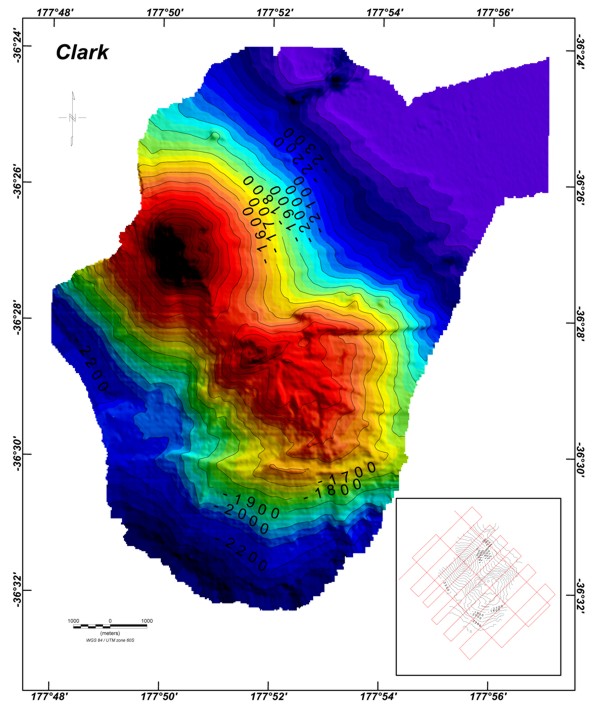
Over the last hours the ship has been pulling a magnetometer (a device for measuring magnetism in the Earth’s crust) back and forth over Clark Volcano, so at the same time the multi-beam sonar was at work to make a new map. This will enlarge the map made 7 years ago on a previous expedition, and also be used as a comparison to see if there have been any major changes to the volcano caused by eruptions or landslides. The top photo is the early version, and the next one is the latest one, produced for the first time today. (pic 3) The new map represents roughly 8 kilometres square.
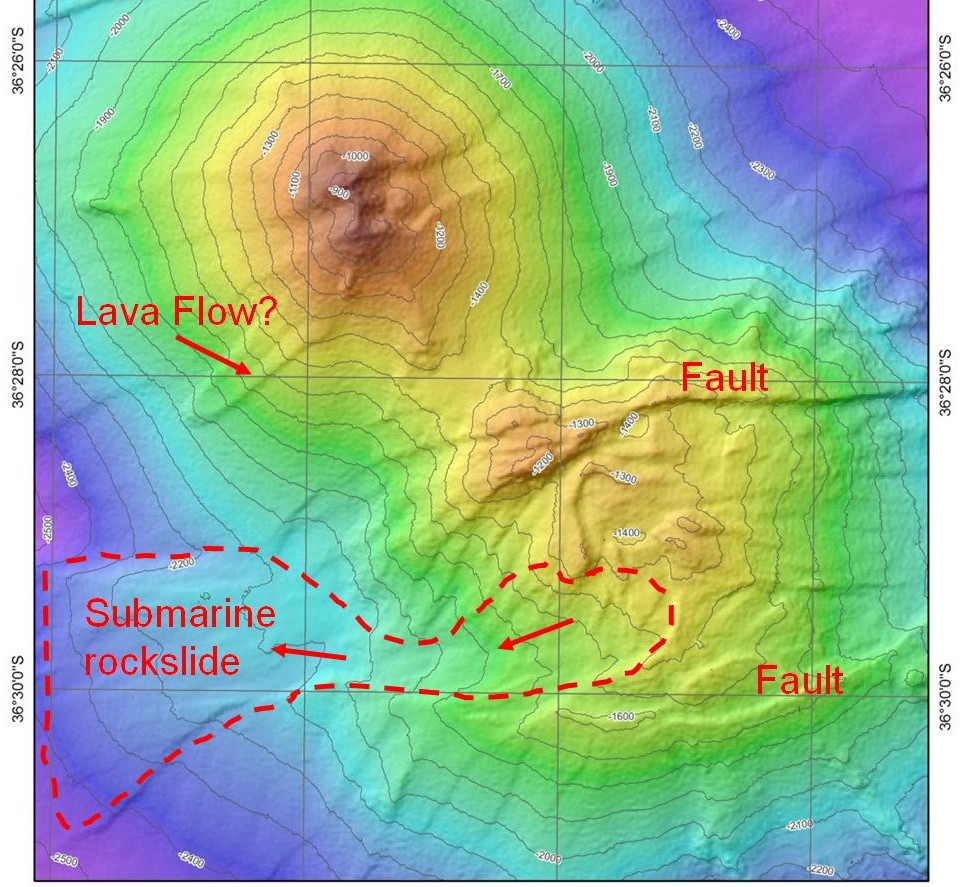 You can see that Clark Volcano has two cones. The one to the north – east (top left) is relatively simple and is most likely much younger than the south – eastern one (bottom right of image).
There are several interesting surface features such as fault lines where the south – eastern cone has rifted apart, possible lava flows and a large rockslide. The next operation is to send a camera down to have a close up look for any hydrothermal activity.

This is a 3D version of the new scan of Clark Volcano, which makes its landforms stand out more clearly. These digital terrain models can easily be manipulated to show the sea floor geological features from any angle.
What sonar were you using? Was that an EdgeTech Side Scan + Bathymetry Sonar?
Answer: The sonar used on the Tangaroa is a Kongsberg EM302 multibeam