Earthquake

What’s on our Plates?

Researching tsunami deposits on the East Coast

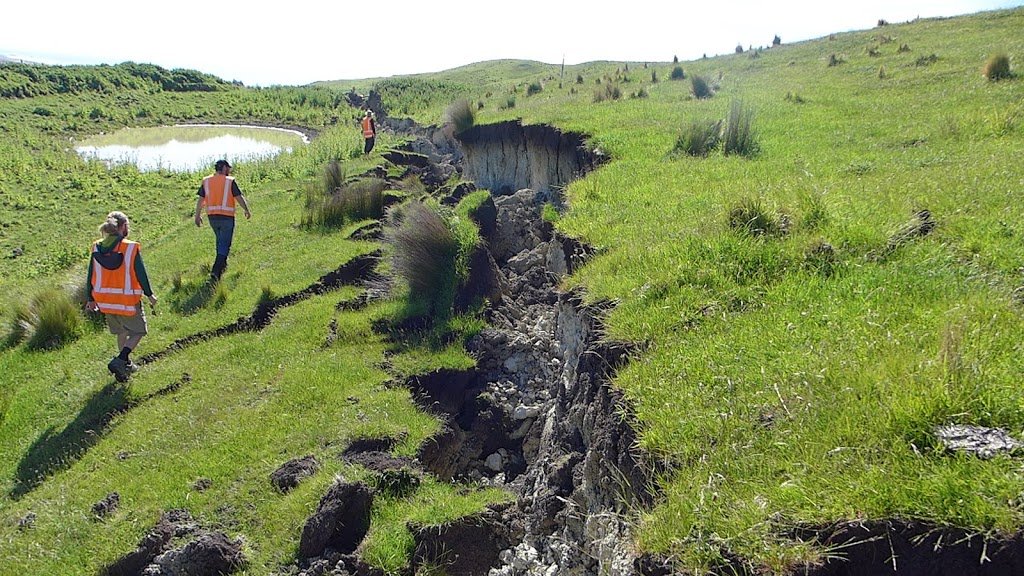
New Zealand has thousands of active faults each of which will produce an earthquake of some magnitude when it ruptures. However the two giants are the Alpine Fault and the Hikurangi Subduction Fault. They each form a segment of the plate boundary – the Alpine Fault can be traced across land, the length of the South Island, whilst the Hikurangi Subduction Fault is lying in wait under the Eastern part of the North Island, with its surface trace hidden deep underwater along the bed of the Hikurangi Trough and Kermadec Trench. Kekerengu Fault rupture in Nov 2016 (J.Thomson / GNS) Each of these plate boundary faults is capable of causing a massive earthquake greater than magnitude 8, thereby wreaking major destruction and disruption across New Zealand. It makes sense then that a lot of research effort is going in to understanding the past history of these faults. This allows us to gain insight into the probabilities of future ruptures and the sorts of impacts that could occur when one or the other of them next produces a big ‘quake. It also makes sense that if you are living in New Zealand, you should be interested in learning about how the scientists go about their research and what they have been discovering! What’s On Our Plates? is a set of free multimedia learning modules designed to enable anyone to explore Aotearoa New Zealand’s active plate boundary online, including the Alpine Fault and Hikurangi Subduction Zone. The modules are for any interested non specialist who would like to know more about out Plate Boundary research, but they also include notes for teachers who would like to use them as an educational resource. So get ready to dig in to the fascinating story of our two colliding tectonic plates. You can access the modules here.   The resource has been created by a collaboration of AF8 (Alpine Fault Magnitude 8) and East Coast LAB (Life At the Boundary). AF8 is undertaking a comprehensive study of the impacts a rupture of the Alpine Fault would have on infrastructure and the people living in communities across the South Island. It is a collaboration between the South Island Civil Defence Emergency Management (CDEM) groups and scientists from six universities and Crown Research Institutes, emergency services, lifelines, iwi, health authorities and many other partner agencies. The programme is managed by Emergency Management Southland. East Coast LAB (Life at the Boundary) is also a collaborative programme. It brings together scientists, emergency managers, experts and stakeholders across the East Coast to help us better understand and prepare for the natural hazards such as earthquakes and tsunami that may affect us. https://youtu.be/L8UXkQmbHZw

What’s on our Plates? Read More »

Raised Beaches at Tora

Raised beach ridges at Tora

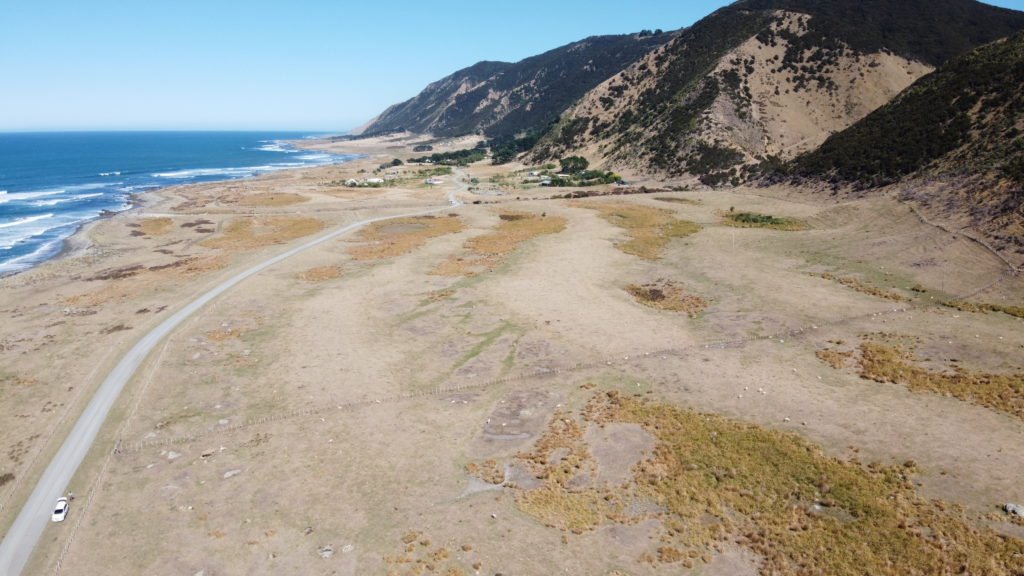
Tora is a small rural community on the Wairarapa Coast of the North Island of New Zealand. There are many interesting geological outcrops and landforms in the area. For me the most spectacular of these are in the area of sloping farmland just south of where the inland road meets the coast. On a recent trip to the area to scope out some school field trips (which were unfortunately cancelled due to the Covid-19 lockdown) I was able to take some images from the air with my drone. They show a series of light and dark parallel stripes running between the shoreline and the steep hillside about 200 to 300 metres inland. The light coloured stripes are ridges, with hollows in between that are picked out by the darker coloured swampy vegetation. These ridges were formed during storms along the beach, when large waves heaped up the rocks into a storm ridge just above high tide level. The reason there are several ridges in a sequence is that earthquakes have pushed up the land periodically, causing the active ridge to become isolated above shore level as the sea retreated to start creating a new ridge. This means that the oldest ridge is furthest inland, up against the hillside and the youngest ridge is presently active along the shore. There are at least 6 abandoned ridges that can be identified, with a seventh in the making at the top of the present day beach. Between the ridges are areas of low lying land that drains poorly, hence the swamp plants within these hollows. It is believed that the sea was up against the hill slopes about 7,000 years ago so that tells us that there is very roughly one earthquake uplift event every 1000 years. The fault responsible for these uplifted beach ridges (the Palliser-Kaiwhata fault) is about 5 to 8 km offshore and is about 60km long.It is a reverse fault where the west side (landward side) thrusts up and over the eastern (seaward) side. Kate Clark of GNS Science sent me this LIDAR image of the area which shows the uplifted beach ridges really clearly. LIDAR is a 3D laser scanning technique that creates images that exclude the vegetation cover and therefore show up the ground surface in incredible detail. The image shows the shoreline from lower left to upper right with the lines of the raised beach ridges between the sea and the prominent hills. Here is a short video I made to explain these features that you may be interested in checking out:

Raised Beaches at Tora Read More »

Landslide Dam

Seaward Slide, J.Thomson @ GNS science Rockfalls and landslides were one of the dramatic consequences of the M7.8 Kaikoura Quake. This first photo shows one that is actually so huge that you might not at first recognise it for what it is. The white cliff in the distance is the landslide scarp and the huge green capped pile of grey in the middle distance is the debris that fell away. This landslide was of course made famous on TV by the cows that became trapped on an isolated hummock in the debris pile. SH1 and Railway, Steve Lawson @ GNS Science A large number of coastal cliffs collapsed, causing spectacular damage to the coastal transport infrastructure. In this image you can see how the raiway line has been lifted up and dropped across the road and across the beach. J.Thomson @ GNS Science Another example of rockfall damage along the coast: Hapuku Landslide, Steve Lawson @ GNS Science In the Canterbury ranges, a short distance inland, a number of landslides have blocked river valleys and created landslide dammed lakes that are now filling up. This image shows the massive Hapuku landslide, which has buried the valley in over 150 metres of debris, weighing many millions of tonnes. The grey coloured lake in the centre of the image is a couple of hundred metres long Hapuku landslide, J. Thomson @ GNS Science This is a close up view of the lake taken a few days later. The lake is now near to the point of overflowing the dam. The problem with these dams is that they can fail catastrophically, sending a debris flow of water, mud and rock down the valley with potentially very destructive consequences. Linton landslide survey, J.Thomson @ GNS Science In this image you can see another landslide, this time in the Linton Valley. It has also dammed a small river. The team here are surveying the debris and the shape of the valley in order to calculate the possible downstream consequences of a breach of the dam. Linton landslide, J.Thomson @ GNS Science This photo shows the size of the landslide.  A large section of forest has slid down with it with many trees still standing. The debris has again blocked the valley to form a lake. Linton landslide dam, J.Thomson @ GNS Science The lake level is still about 10 metres below the rim of the dam: Linton landslide dammed lake, J.Thomson @ GNS Science In order to measure the lake’s water level safely, Chris Massey took a GPS reading from the helicopter whilst it hovered just above the water surface. Linton landslide, J.Thomson @ GNS Science Meanwhile at the base of the dam, some water is percolating through the debris, although the flow in the stream bed is much less than usual: Linton landslide, J.Thomson @ GNS Science This photo shows the toe of the landslide – a mass of rock debris and damaged trees. Linton landslide, J.Thomson @ GNS Science By the end of a few hours, we had lots of data in the form of laser scans of the slip from different locations, as well as hundreds of drone and aerial photos, which are combined to make a 3D digital image that can be used to model the possible consequences of the dam breaching in different ways. This video made by Steve Lawson is a virtual ‘fly through’ of the digital model: And here is a short video about these landslide dams: Finally, there is more information about landslides on the GeoNet website here

Landslide Dam Read More »

The Kekerengu Fault

Photo Tim Little @ VUW Whilst there were many faults that ruptured during the recent M7.8 Kaikoura Earthquake, the Kekerengu Fault is perhaps the most awe inspiring in terms of its effect on the landscape and infrastructure. As it ripped through the countryside, it displaced the land to either side by an astonishing 8 to 10 metres sideways and about 2 metres vertically over many kilometres of its length. Kekerengu Fault offset, J.Thomson @ GNS Science In places this horizontal offset is even more – up to a whopping 12 m. This is impressive on a global scale. In the first two images here you can see what this looks like where farm tracks have been sliced through at a right angle. Here is a drone’s eye view from above: Kekerengu Fault,   J.Thomson @ GNS Science As the trace of the fault passes through different locations, it expresses itself in a number of ways. Across the river from Bluff Station, it has opened up an enormous crevasse, not unlike the sort of thing that mountaineers often see on a glacier. This will be due to either a slight bend in the fault trace, and/or slumping of the downhill side of the fault where there is a slope. Kekerengu Fault,   J.Thomson @ GNS Science Slickensides is the name given to the scrape marks  on the surface of the wall of a fault. Here you can see that they are dipping down at about 28 degrees from the horizontal (towards the south-west). This is useful information to help understand the direction of movement of the rupture, and tells us that this fault moved obliquely (sideways and up).  When we looked across the fault we could see that the land on the far side had moved to the right. It is therefore a ‘dextral’ or ‘right lateral’ oblique slip fault. Kekerengu Fault,   J.Thomson @ GNS Science Fences are really useful markers to allow measurement of the fault offset, especially when they cross the fault at close to 90 degrees.as in this photo. Yes – those two lines of fencing used to join up! Kekerengu Fault,   J.Thomson @ GNS Science The hillside here appears scarred by a simple knife cut… Kekerengu Fault,   J.Thomson @ GNS Science …whereas in other places, the slip is distributed over a broad area of surface deformation. In this case it is likely that the groundshaking helped the hillside follow the call of gravity to spread the deformation over a large area. Kekerengu Fault,   J.Thomson @ GNS Science Near to the coast, the Kekerengu Fault tracks across this field towards the main state highway and the railway. Here the fault trace is a mound of huge clods of earth and ripped turf. We call this a “mole track”, and it results from some compression rather than extension along this part of the fault trace. Kekerengu Fault,   J.Thomson @ GNS Science Not far away, State Highway 1 has been pushed sideways in several pieces… Kekerengu Fault,   J.Thomson @ GNS Science and the nearby railway has been pulled so hard that it snapped. Kekerengu Fault,   J.Thomson @ GNS Science The fault runs right under this small bridge which is totally destroyed. Kekerengu Fault,   J.Thomson @ GNS Science Lots of food for thought and plenty of work ahead for earthquake scientist Russ van Dissen and his colleagues.

The Kekerengu Fault Read More »

A Ruptured Landscape

J,.Thomson @ GNS Science On the ground in the Kaikoura Quake aftermath: Following the recent M7.8 Kaikoura Earthquake, a number of teams of scientists have been deployed to survey the geological impacts and assess the potential ongoing risks to people and infrastructure. This gallery of images shows some of the numerous dramatic impacts of the quake in the coastal area to the north of Kaikoura.  J.Thomson @ GNS Science Accessing the area by road involves careful driving. The road surfaces next to many of the bridges have subsided, creating a crack at either end of the bridge:  J.Thomson @ GNS Science Slumping has occurred along parts of the highway:  J.Thomson @ GNS Science This photo shows the now famous house at Bluff Station that had the mis-fortune to be built directly on top of the Kekerengu Fault. The house was shunted about 7 metres sideways leaving some of its foundations behind. J.Thomson @ GNS Science  The house was pushed across its own driveway… J.Thomson @ GNS Science  The coastal highway and railway have unfortunately been cut through in several places by fault ruptures. This view looking south at Waipapa Bay shows the northern branch of the Papatea Fault crossing SH1 and heading out to sea. J.Thomson @ GNS Science This is what the road now looks like on the ground. The fault scarp has been bulldozed to allow vehicle access. J.Thomson @ GNS Science A short distance away, the railway line was lifted up and dropped in the grass next to its original gravel bedding. J.Thomson @ GNS Science From the top of the fault rupture, you can see that the displaced railway tracks extend for about 300 metres into the distance. Will Ries @ GNS Science A few hundred metres further south, the southern branch of the Papatea Fault crosses the road and railway. J.Thomson @ GNS Science The earthquake ripped right through the concrete culvert that ran under the road, and again lifted the railway off its bed. J.Thomson @ GNS Science From the air, the scarp of the southern branch of the Papatea Fault is seen to extend like a knife-cut across the shore platform. In this image you can sea the uplifted coastline extending into the distance. The total uplift of the area left (east) of the fault is 5 to 6 metres, whilst the area to the right was uplifted by a smaller amount. Water has been ponded up against the new fault scarp. J.Thomson @ GNS Science A helicopter view showing the scarp of the Papatea Fault close up (across the top of image). The fault movement is thought to have been mostly horizontal with about 2 metres of vertical uplift in addition. J.Thomson @ GNS Science The Papatea Fault scarp is a sheer wall about 2 metres high. J.Thomson @ GNS Science Part of the task for scientists is to measure the uplift along the coast. The high and low water marks make a useful reference point that can be surveyed against the new sea level positions. J.Thomson @ GNS Science Sadly the raised shoreline stranded innumerable sea creatures that now litter the area amongst the seaweed. J.Thomson @ GNS Science Rockfalls have been numerous, and have caused a lot of damage where the road and railway are squeezed up close to the coastal cliffs. J.Thomson @ GNS Science The end of the road? The reason why you won’t be travelling into Kaikoura from the north anytime soon. This rockfall is at the south end of Okiwi Bay, and there are more slips like this further south. There are several GeoTrip locations that you can visit to see the changed landscape along the Kaikoura Coast such as this one 

A Ruptured Landscape Read More »

Precarious Boulders and Earthquakes

The National Seismic Hazard Model is the result of lots of work by scientists to indicate the likelihood of earthquakes happening in different parts of New Zealand. It is made with reference to the historic record of earthquakes that have happened across the country, combined with research into the rupture histories of many individual active faults. Work is done to continuously ‘ground truth’ and improve the Hazard Model through ongoing research and addition of data. Mark Stirling has developed a way of testing the model at particular locations using ancient landforms known as tors that occur in places around the country. These isolated boulders stand like statues. There are many of them near Clyde in Otago, occurring on the flat, uplifted surfaces of nearby ranges, such as the Old Man Range, shown here. You can see that some of these features are quite imposing and have a lot of character. Although some of them are solid looking, there are others that are very delicate.These are the ones that Mark is interested in. The basic idea is to use the beryllium 10 exposure dating method to find out how old these fragile features are, and then to work out the amount of earthquake shaking it would take to knock them down. This tells Mark the minimum amount of time that has lapsed since the occurrence of an earthquake capable of knocking down the feature. This information is then matched with the National Seismic Hazard Model to see if the calculations give similar hazard estimates. Making a numerical calculation of the fragility of the precarious feature is a matter of working out the angles between the centre of mass and the rocking points at the neck (narrowest point) of the tor. For making these calculations with maximum precision, Mark makes a 3D computer model of the tor, by first taping key points on its surface, and then taking many photos from all angles, which are later stitched together. This is what the model of the above tor looks like on the computer screen once completed . During fieldwork with Mark last month, we were able to use a quadcopter drone to get good images of some of the more inaccessible fragile landforms. Here is our video of the project:

Precarious Boulders and Earthquakes Read More »

Nature’s Earthquake Recorders

In order to make sense of the sediment cores that can be retrieved from lakes near to the Alpine Fault such as Lake Christabel, it is worth having a think about what happens to the environment when the fault ruptures in a large earthquake. Under normal conditions, alpine lakes fill up very slowly with sediment that is fed into them by rivers. The particles settle onto the lake bed gradually, to create a sequence of finely layered mud. When an earthquake occurs, a number of consequences affect the landscape. The soft surface sediment on the bed of the lake gets deformed and folded, and the shallower slopes at the side of the lake collapse to create flowing avalanches (turbidites) that sweep down and across the lake floor. In the nearby mountains, large landslides occur that choke the river valleys with a chaotic mix of large and small rock fragments. In the months and years following the earthquake, the landslide debris is gradually washed into the lake, to form a recognisable layers on top of the turbidite deposit. Eventually, conditions return to normal, with the finely layered sediments gradually covering over all of the evidence of the earthquake and its aftermath. It may be hundreds of years before another earthquake sttikes that is near enough and strong enough to leave its mark in new layers of the lake sediment. Now lets have a look at the real thing – an example of a sediment core that has been retrieved from a New Zealand’s alpine lake. Back in the lab at the University of Otago in Dunedin, Jamie Howarth opens a core tube to reveal the layers of sand and mud from Lake Christabel. Here is a section of the core that shows the finely laminated lake sediments formed in normal conditions (on the right). In the centre you can see that the layers are slightly folded – this is the indication of an earthquake that has deformed these layers. They would have been at or just below the surface of the lake floor at the time. Here Jamie is indicating the remains of a leaf next to the blade of the knife. This is not far below the earthquake layer, and can be used to get a radiocarbon age which will help to date the earthquake event. This dark coarse layer is the next layer that was added to the sequence on top of the folded sediment. It is the base of an earthquake generated turbidite deposit. The material gets gradually finer to the left (‘upwards’) as the cloud of particles slowly settled onto the lake floor. The section shown here is the landscape recovery phase. Dating of the base and top of this layer in several cores has shown that it can take 50 years for the landscape to recover from an Alpine Fault earthquake. During that time, hillsides are destabilised, debris flows cover flat areas near to the mountains, and rivers are prone to changing course due to being overloaded with sediment. Finally we see the thinly layered sediment  indicating that normal conditions have returned to the lake environment. This map shows what can be done when this research is carried out at a number of lakes along the Alpine Fault. The coloured lines (purple, orange, green etc) show earthquake records that have been identified so far in some of the lakes along the length of the fault. You can see that the last earthquake rupture (in 1717 AD) was over 300 km long. The one prior to that around 1600 AD ruptured the northern end of the fault. Information about previous earthquakes is still incomplete, but the picture is starting to become clearer. With more research, Jamie and his colleagues will be able to show a more detailed history of the last 10 Alpine Fault earthquakes including the dates, lengths of rupture and magnitudes of the events.

Nature’s Earthquake Recorders Read More »

Lake Christabel

Lake Christabel   J.Thomson@GNS Science This is Lake Christabel in New Zealand’s South Island. It is one of the many beautiful alpine lakes  to be found close to the Alpine Fault. Lake Christabel was formed when a huge landslide blocked the valley, thus damming the river that then backed up to form the lake.The present day outlet runs over the old landslide deposit of large chaotic boulders. Hidden beneath the waters of Lake Christabel are very distinctive sediment layers that tell the story of huge earthquakes that rocked the nearby mountains during ruptures of the Alpine Fault. Jamie Howarth from GNS Science, and Sean Fitzsimons from Otago University, have been investigating several such lakes to read the earthquake histories. I joined them on a recent expedition along with Delia Strong and Rob Langridge from GNS Science. The aim was to retrieve sediment cores from the lake to investigate the earthquake records. First of all a seismic survey was undertaken to find the best spots to sample on the lake bed. Sean is in the lead boat, towing a second dinghy that carries the equipment. The survey uses an acoustic source that sends pulses down into the water. The boat is towed along so that noise interference produced by a nearby motor is avoided. As the sound pulses are reflected back from the lake bed and its layers of underlying sediment, they are translated into a two dimensional vertical section image of the lake floor. A number of survey lines are made across the lake to give some idea of the 3 dimensional structure of the lake sediments. Once the best locations for sampling have been chosen from the survey results, the corer is prepared with a fresh 6 metre pipe that will be pushed into the lake floor to retrieve a sediment core. The corer is transported to the chosen point on the lake surface, and then dropped off the side of the boat once it is in position. After being connected with several airlines which are required to control the pressure coring process, the corer is lowered the 90 metres to the lake floor. The large barrel sits at the bottom, and is sucked into the mud to create a stable platform for coring. High pressure air is then applied to the piston which pushes the 6 metre coring pipe into the mud, releasing clouds of bubbles up to the surface. These bubbles allow Sean and Jamie to monitor what is going on with the corer at depth. Lake Christabel Corer Retrieval J.Thomson@GNS Science When the coring is complete, an airbag is attached to the line and filled up with air so that it  pulls the whole assembly out of the mud. The airbag bursts up to the surface from below in a spectacular fashion. Lake Christabel Corer Retrieval J.Thomson@GNS Science About a minute later, the corer assembly also emerges from the depths. It is not a good idea to be too close to this as it could easily sink a boat that was in the wrong place. The corer is then plugged and loaded into the boat to be brought back to shore, with its precious cargo of sediment. The PVC tube containing the core is then cut into 1.5 metre lengths for ease of transport. Each tube is carefully labelled to avoid any confusion  about where it was taken from and its relationship to the other samples. Lake Christabel Flight  J.Thomson@GNS Science Once all the sampling has been completed, the expedition is over. It takes several helicopter loads to transport the two boats, safety gear, corers, generators, samples and all our personal equipment back to the road end. The samples are then taken to Otago University for analysis. My next post will describe how alpine lakes like Lake Christabel have shown themselves to be very useful natural seismometers through this research approach.

Lake Christabel Read More »

Imaging the Crust beneath Wellington

Having had a close up look to the surface trace of the Wairarapa Fault (see recent post here), I thought it would be interesting to find out the latest about what such a major geological structure looks like below the earth’s surface. Stuart Henrys and colleagues at Victoria University, the University of Tokyo, Japan, and the University of Southern California, USA, have been busy working on the results of the SAHKE project that ran a large scale seismic survey across the Lower North Island in 2011. The purpose of this survey was to  gain a better understanding of the anatomy of the plate boundary and associated structures below the Lower North Island. This image shows the line of the survey that not only ran across the land surface, but also extended across the sea floor to West and East. Thousands of measurements were recorded, creating a huge dataset that had to be processed to create two dimensional seismic cross sections. SAHKE seismic survey. Stuart Henrys @GNS Science Here is an example of how about 80 kilometres of the section can be displayed to highlight some of the structures in the crust down to 35 kilometres depth SAHKE seismic survey. Stuart Henrys @GNS Science It takes a lot of work to be able to interpret the information to see some of the major structures. You can see that a coherent band of energy deeper than 20 km depth is interpreted to be the plate boundary and descends at a very shallow angle, Also how the Wairarapa and Wellington Faults show up as narrow bands of energy that become low angle thrusts from about 15 kilometres below the surface Stuart Henrys @GNS Science This is a simplified summary of the complete 250 km length of the SAHKE seismic survey: Initially the plate boundary dips at a very shallow angle below the Lower North Island. This angle steepens below the west coast (Kapiti). The blue area is rock that has been scraped off the surface of the Pacific Plate and stuck (“underplated”) onto the base of the Australian Plate. You can think of the Australian Plate acting a bit like a chisel as it scrapes the top off the Pacific Plate in this way, pushing the overlying crust upwards along the Wellington and Wairarapa Faults to give rise to the Rimutaka and Tararua Ranges.  The diagram also shows (in red) where the plate interface is locked (down to about 30 kilometres depth) and the (green) area where it produces slow slip events. Find out more about the potential for very large earthquakes to be generated on Wellington’s Stuck Plate Boundary and also about Slow Slip Events. Tararua Range,  J.Thomson@GNS Science The narrow, long form of the mountains of the Lower North Island may be related to their position above  where the plate boundary dives more steeply downwards with underplated sediments  pushing the ranges up. Cross section of SAHKE seismic survey. Stuart Henrys @GNS Science Here is a more detailed image for you to explore if you are interested, showing some examples of earthquake locations (grey dots) in relationship to the crustal structures: UPDATE 5th Feb 2015:  Have a look at this media release about further groundbreaking discoveries resulting from this research project – “Scientists discover slippery base on underside of Pacific Plate”

Imaging the Crust beneath Wellington Read More »

Wairarapa Fault – the Biggest Rupture on Earth

The Wairarapa Fault is one of New Zealand’s large active faults running along the eastern edge of the Rimutaka range from Palliser Bay north into the Wairarapa. It was responsible for the massive magnitude 8.2 earthquake that violently shook the lower North Island in 1855 in New Zealand’s largest historically recorded ‘quake. This Google Earth view shows the surface trace of the fault, with the Rimutaka Range to the west and the Tararuas in the distance. An interesting location called Pigeon Bush is indicated by the red circle. It is about 50 kilometres north-east of Wellington City. Photo Andrew Boyes / GNS Science The second photo is a view of the Pigeon Bush locality from the nearby road, showing a steep scarp uplifted by earthquake ruptures of the fault. The fault itself runs along the base of the scarp, which is the product of several earthquakes over the last few thousand years. A close up view shows some interesting features beside the fault scarp. Two stream  channels (middle and foreground of image)  appear out of the scarp, with no sign of any catchment gully above them. Meanwhile a bit further along (where the trees are) you can see that there is a deep cut gully in the scarp itself. Geologists have long recognised that the stream that created the two small ‘beheaded’ channels has been shunted along horizontally by the last two ruptures of the fault. In this photo, Rob Langridge, an earthquake geologist from GNS Science, is standing between the first (most recently beheaded) stream channel on the left, and the vegetated gully that was originally connected with it on the right. Some idea of the amount of offset that occurred in the 1855 earthquake can be appreciated from the image. There would also have been some uplift during that earthquake of perhaps one or two metres at this location.  We used a tape measure and recorded the distance along the fault between the centre of the now separated stream gullies, and came up with a figure of about 18 metres. This huge displacement is the largest offset to have been caused by a single earthquake on a land based fault known from anywhere in the world. (It is now known that subduction earthquakes such as the great 2011 Tohoku Earthquake of Japan can produce even greater displacements of the ocean floor) We also measured the offset of the older stream channel which was about 15 metres away from the first beheaded channel.This previous earthquake is thought to have occurred about 1000 years ago. The average repeat interval for ruptures of the Wairarapa Fault is thought to be about 1200 years. Offset stream channels at Pigeon Bush, A Boyes / GNS Science Here is an image taken using a drone and annotated by Andrew Boyes at GNS Science: About 45 kilometres north of Pigeon Bush it is possible to see a view of the fault itself in a cutting of the Ruamahanga River near Masterton. In the photo you can see how older grey rock on the right (west) have been pushed up relative to the younger gravels on the left (east) in a reverse fault. The substantial horizontal movement may also have caused this juxtaposition of older rocks against younger ones. Here is another view of the fault where it is known as the Wharekauhau Thrust in a cliff section at Thrust Creek on the Palliser Bay coast. Royal Society Teacher Fellow Phillip Robinson is inspecting the older shattered greywacke rocks that have been thrust over the gravels from the west (left), tilting the relatively young 50 000 year old gravel layers from a horizontal to a vertical orientation. This is the view looking south from Thrust Creek along to the southern tip of the Rimutaka Range, with Turakirae Head in the far distance. During the 1855 earthquake, a maximum of 6 metres of uplift occurred along this coast. A 10 metre high tsunami also swept along this coastline. Check out this previous post to learn about the amazing uplifted beaches at Turakirae Head. Note that you can now find out how to visit Thrust Creek (and many other geology locations) on our GeoTrips website here: https://geotrips.org.nz/trip.html?id=255

Wairarapa Fault – the Biggest Rupture on Earth Read More »