Earth Science

You change the description here

Where to explore the Wellington Fault

Wellington Fault at Thorndon

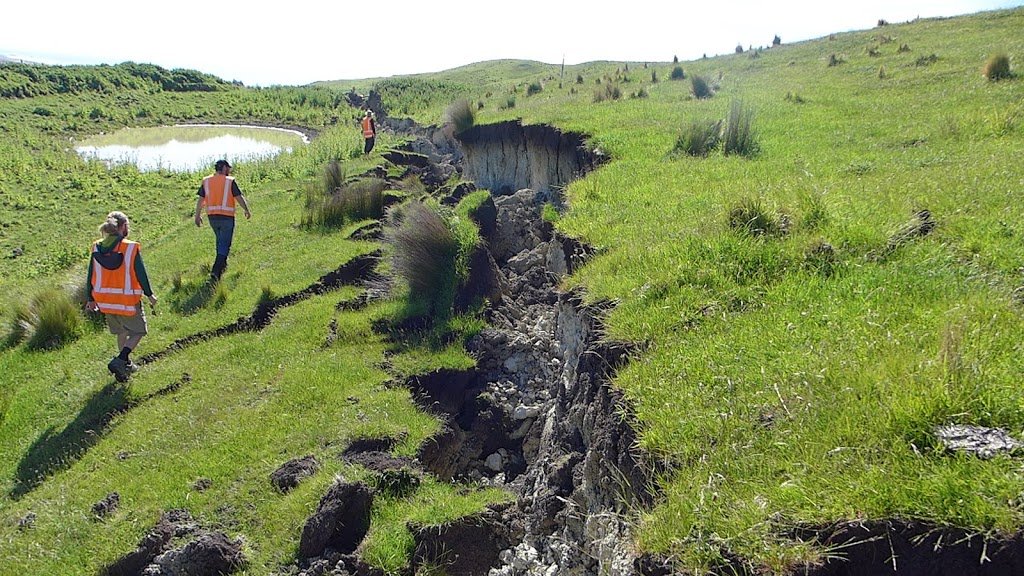
The Wellington Fault is one of several large active faults in the lower North Island of New Zealand. From the Tararua Mountains and Kaitoke it runs the length of the Hutt Valley, the edge of Wellington Harbour, through Tinakori in the City and across the hills to Cook Strait. Earthquakes occur on the Wellington Fault approximately every 700 to 1000 years on average, with the last between 170 and 370 years ago. The probability of a rupture in the next 100 years is calculated to be about 10%. Because it runs along the highly populated Hutt Valley and right through the Capital City via its transport bottleneck, it is regarded as one of the country’s highest risk faults. You can find out information about all of New Zealand’s known active faults on the GNS Science Active Faults Database, but in this image you can see a screen grab of those known in the Wellington area, some of them labelled: As you can see there are many other faults in the region, each of which is capable of rupturing, so that the real possibility of a large earthquake occurring at some point from one or other of the faults is something that should inspire everyone to be prepared. (Make some time to go to https://getready.govt.nz/ ) As you can see there are many other faults in the region, each of which is capable of rupturing, so that the real possibility of a large earthquake occurring at some point from one or other of the faults is something that should inspire everyone to be prepared. (Make some time to go to https://getready.govt.nz/ to get the best information on how to do this.) Here is an aerial view of the Wellington Fault trace (bottom right to centre top of the photo) passing through California Park in Upper Hutt and along the centre of  California Drive beyond In neighbouring Harcourt Park, the fault crosses a flight of river terraces at a right angle. This allows us to see clearly that the slip (movements) on the fault are mostly horizontal with some vertical movement as well. Looking across the fault the opposite side moves to the right. This means that the fault is a “dextral oblique slip fault”.   This diagram shows how the Harcourt Park River Terraces are offset by the Wellington Fault The fault can be followed along the Hutt River. In Lower Hutt it runs right along the side of Hutt Road, and into Petone. This photo shows the fault scarp at the end of Te Mome Road where it meets Hutt Road at a T junction:   The entrance to Wellington City at Thorndon is a bottleneck, where the Wellington Fault passes underneath the railway, State Highway and Ferry Terminal, as well as the water supply. This makes Wellington vulnerable to being cut off by a rupture of the Wellington Fault. You can learn more by visiting the Wellington Fault at several points from Upper Hutt to Wellington. Check out this video for details:  

Where to explore the Wellington Fault Read More »

Geology of Bitou, Lailai and Beiguan, Taiwan

Bitou – this small fishing village is about 70km north of Yilan City. Right next to it is the Bitou Geopark. Here you can take a clifftop walk above steep sandstone cliffs, or descend to the shore platform to see some strange mushroom like features at close quarters Here the shore platform is festooned with these strange mushroom shaped concretions. They really are unusual, and make this a famous geological location in Taiwan. As you can see it is also a popular spot for fishing. Due to storms and occasional freak waves there are many accidents all along this coast where people get swept into the sea. Our next stop was the well known shore platform at Lailai. Here the gently dipping sedimentary beds have been folded and faulted. with hard layers of sandstone being less easily eroded (and therefore sticking out more) than the more easily etched out softer mudstones. The shore platform is impressive, with the tilted sedimentary rocks folded into gentle curves, and a lot of faults cutting through the layers. It was a perfect area to use my drone to get these aerial images. A short distance away there is a dyke (an igneous intrusion that originally pushed into the sedimentary rocks as hot magma)  that can be soon cutting through the sedimentary layers of the shore platform. It stands out because it is made of harder rock than the surrounding sediments, and is therefore more resistant to being eroded. Here you can see the dyke is offset – sometimes by faults but also simply by the magma pushing up through slightly different pathways in the original country rock. You can see here how the dyke has baked the adjacent mudstone – giving it a darker colour for about 40cm  to either side of the once hot dyke. A closer view of the dyke standing up like a man-made wall on the shore platform. The baked sediments right next to it have also been hardened by the heating process, so they have also resisted erosion more than the softer surrounding rocks. This video shows a bit more detail of the rocks of Lailai ,which I think is an ideal place to run a geological field trip: Finally on our way back to Dongshan, we stopped in the small Beiguan Tidal Park where you can see these rocks with impressive joints forming a diamond checkerboard pattern. In the background is Turtle Island, another well known local feature.

Geology of Bitou, Lailai and Beiguan, Taiwan Read More »

Geology on the Yilan Coast, Taiwan

To find worthwhile locations that offer great learning opportunities in geology, you have to spend time exploring outcrops, trying to make sense of the geological features that are exposed and then think of ways that students can explore and make sense of them out of their own activity. This inquiry learning process can work well via guided questions that encourage careful exploration and observation and then the unfolding of ideas and understanding. however it doesn’t usually just happen by magic – it takes some working out to frame interesting learning activities at a given unique location. With a small group of teachers from CiXin School, we explored several locations along the coast north and south of Yilan. Heading South we went to a coastal fishing settlement called Feniaolin. Here there were some amphibolites (metamorphic rocks) that are part of a long outcrop extending further south. These are amongst the oldest rocks in Taiwan and have been exhumed from many kilometres deep in the earth’s crust. Just past the fishing wharf there is an area of sea stacks – classic coastal erosion features: We continued further south to the Nanao Valley where there is a mixture of rocks on the river bed including many huge boulders. Some of the boulders were granites (that were once molten magma deep in the earth). They had lumps of schist included in them – fragments of the crustal rocks (xenoliths) that must have been incorporated into the molten magma before it crystallised. – given them a very striking apprearence. All in all there is plenty here to discover – rocks and minerals that have been metamorphosed by intense pressure and heat a long way down in the earth’s crust. Here is a video I made about our trip:

Geology on the Yilan Coast, Taiwan Read More »

Natural Hazards Science for East Coast Schools

Natural Hazards Activities for Schools This article is about a science education project that I was involved in that was supported by MBIE’s Unlocking Curious Minds fund in 2018. It involved four three-day natural hazards science camps for intermediate level students in New Zealand’s rural Tairawhiti (Gisborne – East Cape) region. A total of 109 year 7 and 8 students and 16 teachers, from 19 schools were represented. The science camps were based at four different locations (Gisborne, Te Karaka, Tolaga Bay and Ruatoria / Te Araroa) with the activities and field trips tailored to suit each area. The events included lots of field trips and hands-on problem solving tasks. Here for the record is a summary of some of the activities and also a few of the places we visited: Introductory activities included observation and thinking exercises around the theme of science and natural hazards. These included demonstrations such as: earthquake P (longitudinal) and S (transverse) waves using slinky springs. A TC1 seismometer was used to demonstrate how ground shaking (created by participants jumping on the floor) can be captured as a wave trace on a projector screen, giving a record of the magnitude (energy) and duration of the vibrations. The TC1 can be used by schools and individuals who wish to detect earthquakes and interact with other enthusiasts online as part of the Ru programme in New Zealand Rock deformation: Alternating layers of flour and sand in a transparent container show how rocks can be faulted and folded by compression of the earth’s crust. For information about this demonstration have a look this earthlearningidea.com page. For a bit of a hands-on problem solving challenge, participants were invited to create some model structures to protect an area fromcoastal erosion. The models were set up in shallow storage containers. Once the ‘seawalls’ were built, the area behind them was backfilled with sand, the containers tilted at a shallow angle, and water added to within about 15cm of the ‘sea wall’. Here is one example: Testing involved using a plastic lid to push the water in waves up against the seawall, first gently, then with increasing energy. Different designs could then be compared and strengths and weaknesses discussed.   Following this exercise we travelled to Wainui Beach, Gisborne where there has been a variety of attempts to protect the foredunes which have properties built on them. Interestingly, many of the methods that had been used were similar to those that the students thought of with their model making. Here you can see the remains of a concrete wall that has been undermined by wave erosion    Another similar model making exercise, this time including a slope of cardboard at one end, was to design rockfall barriers.  These were also tested to destruction using varying quantities and sizes of rocks rolled down the slope. We were also able to do another activity associated with flooding which has been a big issue this year in the Gisborne area.The photo shows the sediment covering some of the farmland near Te Karaka following the floods. For this activity, participants had to design a stop-bank, and test how long it could retain water, by recording any pooling of water on the ‘dry’ side , every 30 seconds. If you are an educator wanting information sheets to run these activities they can be found on the GNS Science website learning pages here. Here are some of the field locations that we visited, and what we investigated at them: At Pouawa Beach, north of Gisborne, we made careful drawings of some deposits that are thought to have been laid down by a tsunami. Shells in these layers have been radiocarbon dated at about 2000 years old. The layers include gravel and shells that would have been transported from the sea floor. Using a  drone we could get a good view the top of a marine terrace (the flat surface upper left of pic) at the north end of the beach. The terrace was formed at sea level as a wave-cut platform during the last interglacial (about 80 thousand years ago), and has been uplifted since its formation by tectonic activity. There is a wide shore platform which you can see just covered by water in the photo. Another great example is nearby at Tatapouri –  for more information check out the GeoTrip here – these surfaces will also be uplifted eventually to form another step in the landscape. These marine terraces show that earthquakes and tsunamis have a long history on the East Coast! At the north end of the beach. we passed a landslide that had occurred during the very wet weather in June 2018. From the ground we could see the toe of the slip which included tree trunks, boulders and lots of muddy sediment. With our drone, we were able to get a much more complete view of the slip, including the source area, which was not visible from where we were standing. This shows clearly the value of drone technology as a tool to extend our view of this active landscape: Next stop Tolaga Bay, where the beach has been covered by logs, brought down from the forestry plantations by the recent heavy rainfall. The logs caused a lot of damage to properties, bridges and land as they travelled down the flooded rivers. Here we spent some time analysing the types of logs scattered on the beach, by counting the different species (pine, poplar, willow or other) within 10m square quadrats. The results showed that by far the majority came from pine forestry. We were able to visit a forestry area inland of Tolaga Bay, which showed that following harvesting of the pine trees, there is a period of time where the land is vulnerable to erosion before the next generation forest grows large enough to stabilise the soil. Following clear-felling, the slash (abandoned logs and branches) can get washed into rivers during heavy rainfall. Further North still we did a day trip

Natural Hazards Science for East Coast Schools Read More »

Volcano City

Mangere Mountain, L. Homer / GNS Science Volcanic cones, explosion craters and lava flows form much of Auckland’s natural topography. All of these, apart from one (Rangitoto Island) are from vents that erupted once only (monogenetic), with eruptions lasting a few weeks or months and then ceasing completely.  There are many accessible and beautiful locations that can be visited to uncover the geological history of the area. Auckland volcanoes, GNS Science Although there are about 50 volcanoes within a 20km radius of the city, there is a similar eruption process that generated them, with three main possible styles of eruption. Knowing the difference between these eruption styles allows you to interpret the different features and rock types of each of the volcanoes that you might wish to explore. The magma that erupts in the Auckland Volcanic Field (AVF) is generated in a ‘hotspot’ about 80 to 100 kilometres below the surface. It is a very fluid type of basalt that is known to rise quickly to the surface (at up to 5km / hour) from the magma source. Tuff outcrop at North Head, J..Thomson / GNS Science Once at the surface, the style of eruption depends largely on the amount of groundwater or sea water present. If there is a lot of water near the vent, its interaction with the hot magma (1000 plus deg C) causes it to instantly vaporise.  This, along with the expansion of gases within the lava itself, creates extremely violent eruptions that fragment the lava into small particles and blasts them upwards and sideways from a wide, flat explosion crater. This becomes surrounded by a ring of ash. Such deposits are known as tuff (pronounced ‘toof’ as in ‘woof’). You can see outcrops of this in Auckland, for example around the shoreline at North Head. Each individual layer represents an explosion from the vent. Surtsey eruption, courtesy NOAA This type of eruption is known as a phreatomagmatic or wet eruption, and a classic example occurred off the coast of Iceland from 1963-67 when the island of Surtsey was born. Mount Eden Crater, J.Thomson / GNS Science Scoria outcrop, Mount Wellington, J.Thomson / GNS If the magma reaches the surface where there is little interaction with water there is a different type of eruption. This includes eruptions in areas of dry land, as well as those that start off as wet eruptions, but where the water supply near the vent gets used up before the supply of erupting magma runs out. The magma then erupts in a fountain of lava, driven up by gases within it that are expanding as the pressure is reduced.The lava fountains might be several hundreds of metres high, with blobs of lava partially solidifying in mid-flight, and landing as scoria in a ring around the vent. This is a bit like the froth coming out of a soda bottle once the lid has been removed.  The scoria pieces and lava bombs are relatively sticky and can build the steep sided cones that are very recognisable in the Auckland landscape. The reddish colour comes from the oxidation of iron in the magma as it cools during its flight through the air. Lava bomb approx 1/2 m in length, Mangere Mountain  If you look at the rock that makes up these cones, you will see that it is made of bombs and fragments that may be partially glued together or more or less loose and rubbly. Takapuna lava flow, J.Thomson / GNS Science If one of these eruptions gets to the stage where the gas has mostly been expelled, then there is less energy available and the fire-fountaining stage ends. Should the eruption continue (which is not always the case) then the third eruption style starts to dominate. Lava pours out of the vent and pushes through the sides of the scoria cone to spread out around the volcano. Because it is such a fluid type of lava, a  variety of flow structures are preserved when it finally solidifies. Lava tree mould with bark impression, J.Thomson / GNS A great example of such a lava flow can be found along Takapuna Beach. About 200,000 years ago lava poured out of the nearby Pupuki crater and flowed through a forest. The tree trunks and branches were surrounded by the lava which cooled around them. The trees then burnt, leaving tree shaped holes within the lava. Takapuna Fossil Forest and Rangitoto, J.Thomson / GNS For more information about where to go in Auckland to see some of these geological localities, have a look at our new online map of geological locations atwww.geotrips.org.nz Could a volcanic eruption occur in Auckland in the future? What are the probabilities in the short to medium term and what would the impacts be? The short answer to the first question is ‘Yes,  definitely!’ There is no reason to think that eruptions won’t occur again. In order to answer the last two questions (‘When?’ and ‘What?’) it is important to get as clear a picture as possible of the history of past events, their timing, duration and magnitude, and their geographic relationship to the housing and infrastructure in the wider Auckland area. Auckland Museum Volcanic Eruption Auckland City and Mount Victoria, J.Thomson / GNS These questions are the focus of a long term scientific programme called DEVORA (Determining  Volcanic Risk in Auckland). DEVORA is led by GNS Science and the University of Auckland, and is core-funded by the EQC and Auckland Council. The first part of this programme has been to further our knowledge of the eruption history of the Auckland Volcanic Field volcanoes. What this work has shown is that there is no simple pattern that we can project to help easily forecast the likelihood of eruptions in the future. The timeline of eruptions shows them to be clustered, with large gaps between phases of relatively high activity.  Graham Leonard, photo by Brad Scott / GNS Graham Leonard of GNS Science is a co-leader of the project. He comments

Volcano City Read More »

GeoTrips – visiting New Zealand’s geology and landforms

The Tasman Glacier Lake from the air

Tasman Glacier Lake,  J.Thomson / GNS Science New Zealand is an isolated country with a very active plate boundary running right through it. For a relatively small landmass it has an astonishing variety of landscapes and is being continuously subject to dramatic physical occurrences that include earthquakes, volcanic eruptions, floods, landslides, rapid erosion and sedimentation. The geology of New Zealand can be explored in innumerable individual localities that each give individual insights into the geological story, like pieces of a jig saw puzzle. In order to visit these locations, a non specialist normally has to seek information in widely scattered sources such as specialist papers, local guidebooks, various websites or visitor centres. Many of these are out of print or out of date, and hard to get hold of. To overcome this issue, GNS Science has created a New Zealand geological locations map that allows interested people (eg members of the public, researchers, teachers and students) to have the information they need to explore our geology first hand. The content is provided by geoscientists and is aimed to encourage you to go to these localities and make your own observations, just like scientists do. As well as some geological background, there are images, directions, and some basic safety and accessibility information too. You can search the map using filters to focus on specific topics, rating scales or accessibility.  So… have a look, explore and plan some trips to become a New Zealand geological investigator!  www.geotrips.org.nz  

GeoTrips – visiting New Zealand’s geology and landforms Read More »

Landslide Dam

Seaward Slide, J.Thomson @ GNS science Rockfalls and landslides were one of the dramatic consequences of the M7.8 Kaikoura Quake. This first photo shows one that is actually so huge that you might not at first recognise it for what it is. The white cliff in the distance is the landslide scarp and the huge green capped pile of grey in the middle distance is the debris that fell away. This landslide was of course made famous on TV by the cows that became trapped on an isolated hummock in the debris pile. SH1 and Railway, Steve Lawson @ GNS Science A large number of coastal cliffs collapsed, causing spectacular damage to the coastal transport infrastructure. In this image you can see how the raiway line has been lifted up and dropped across the road and across the beach. J.Thomson @ GNS Science Another example of rockfall damage along the coast: Hapuku Landslide, Steve Lawson @ GNS Science In the Canterbury ranges, a short distance inland, a number of landslides have blocked river valleys and created landslide dammed lakes that are now filling up. This image shows the massive Hapuku landslide, which has buried the valley in over 150 metres of debris, weighing many millions of tonnes. The grey coloured lake in the centre of the image is a couple of hundred metres long Hapuku landslide, J. Thomson @ GNS Science This is a close up view of the lake taken a few days later. The lake is now near to the point of overflowing the dam. The problem with these dams is that they can fail catastrophically, sending a debris flow of water, mud and rock down the valley with potentially very destructive consequences. Linton landslide survey, J.Thomson @ GNS Science In this image you can see another landslide, this time in the Linton Valley. It has also dammed a small river. The team here are surveying the debris and the shape of the valley in order to calculate the possible downstream consequences of a breach of the dam. Linton landslide, J.Thomson @ GNS Science This photo shows the size of the landslide.  A large section of forest has slid down with it with many trees still standing. The debris has again blocked the valley to form a lake. Linton landslide dam, J.Thomson @ GNS Science The lake level is still about 10 metres below the rim of the dam: Linton landslide dammed lake, J.Thomson @ GNS Science In order to measure the lake’s water level safely, Chris Massey took a GPS reading from the helicopter whilst it hovered just above the water surface. Linton landslide, J.Thomson @ GNS Science Meanwhile at the base of the dam, some water is percolating through the debris, although the flow in the stream bed is much less than usual: Linton landslide, J.Thomson @ GNS Science This photo shows the toe of the landslide – a mass of rock debris and damaged trees. Linton landslide, J.Thomson @ GNS Science By the end of a few hours, we had lots of data in the form of laser scans of the slip from different locations, as well as hundreds of drone and aerial photos, which are combined to make a 3D digital image that can be used to model the possible consequences of the dam breaching in different ways. This video made by Steve Lawson is a virtual ‘fly through’ of the digital model: And here is a short video about these landslide dams: Finally, there is more information about landslides on the GeoNet website here

Landslide Dam Read More »

The Kekerengu Fault

Photo Tim Little @ VUW Whilst there were many faults that ruptured during the recent M7.8 Kaikoura Earthquake, the Kekerengu Fault is perhaps the most awe inspiring in terms of its effect on the landscape and infrastructure. As it ripped through the countryside, it displaced the land to either side by an astonishing 8 to 10 metres sideways and about 2 metres vertically over many kilometres of its length. Kekerengu Fault offset, J.Thomson @ GNS Science In places this horizontal offset is even more – up to a whopping 12 m. This is impressive on a global scale. In the first two images here you can see what this looks like where farm tracks have been sliced through at a right angle. Here is a drone’s eye view from above: Kekerengu Fault,   J.Thomson @ GNS Science As the trace of the fault passes through different locations, it expresses itself in a number of ways. Across the river from Bluff Station, it has opened up an enormous crevasse, not unlike the sort of thing that mountaineers often see on a glacier. This will be due to either a slight bend in the fault trace, and/or slumping of the downhill side of the fault where there is a slope. Kekerengu Fault,   J.Thomson @ GNS Science Slickensides is the name given to the scrape marks  on the surface of the wall of a fault. Here you can see that they are dipping down at about 28 degrees from the horizontal (towards the south-west). This is useful information to help understand the direction of movement of the rupture, and tells us that this fault moved obliquely (sideways and up).  When we looked across the fault we could see that the land on the far side had moved to the right. It is therefore a ‘dextral’ or ‘right lateral’ oblique slip fault. Kekerengu Fault,   J.Thomson @ GNS Science Fences are really useful markers to allow measurement of the fault offset, especially when they cross the fault at close to 90 degrees.as in this photo. Yes – those two lines of fencing used to join up! Kekerengu Fault,   J.Thomson @ GNS Science The hillside here appears scarred by a simple knife cut… Kekerengu Fault,   J.Thomson @ GNS Science …whereas in other places, the slip is distributed over a broad area of surface deformation. In this case it is likely that the groundshaking helped the hillside follow the call of gravity to spread the deformation over a large area. Kekerengu Fault,   J.Thomson @ GNS Science Near to the coast, the Kekerengu Fault tracks across this field towards the main state highway and the railway. Here the fault trace is a mound of huge clods of earth and ripped turf. We call this a “mole track”, and it results from some compression rather than extension along this part of the fault trace. Kekerengu Fault,   J.Thomson @ GNS Science Not far away, State Highway 1 has been pushed sideways in several pieces… Kekerengu Fault,   J.Thomson @ GNS Science and the nearby railway has been pulled so hard that it snapped. Kekerengu Fault,   J.Thomson @ GNS Science The fault runs right under this small bridge which is totally destroyed. Kekerengu Fault,   J.Thomson @ GNS Science Lots of food for thought and plenty of work ahead for earthquake scientist Russ van Dissen and his colleagues.

The Kekerengu Fault Read More »

A Ruptured Landscape

J,.Thomson @ GNS Science On the ground in the Kaikoura Quake aftermath: Following the recent M7.8 Kaikoura Earthquake, a number of teams of scientists have been deployed to survey the geological impacts and assess the potential ongoing risks to people and infrastructure. This gallery of images shows some of the numerous dramatic impacts of the quake in the coastal area to the north of Kaikoura.  J.Thomson @ GNS Science Accessing the area by road involves careful driving. The road surfaces next to many of the bridges have subsided, creating a crack at either end of the bridge:  J.Thomson @ GNS Science Slumping has occurred along parts of the highway:  J.Thomson @ GNS Science This photo shows the now famous house at Bluff Station that had the mis-fortune to be built directly on top of the Kekerengu Fault. The house was shunted about 7 metres sideways leaving some of its foundations behind. J.Thomson @ GNS Science  The house was pushed across its own driveway… J.Thomson @ GNS Science  The coastal highway and railway have unfortunately been cut through in several places by fault ruptures. This view looking south at Waipapa Bay shows the northern branch of the Papatea Fault crossing SH1 and heading out to sea. J.Thomson @ GNS Science This is what the road now looks like on the ground. The fault scarp has been bulldozed to allow vehicle access. J.Thomson @ GNS Science A short distance away, the railway line was lifted up and dropped in the grass next to its original gravel bedding. J.Thomson @ GNS Science From the top of the fault rupture, you can see that the displaced railway tracks extend for about 300 metres into the distance. Will Ries @ GNS Science A few hundred metres further south, the southern branch of the Papatea Fault crosses the road and railway. J.Thomson @ GNS Science The earthquake ripped right through the concrete culvert that ran under the road, and again lifted the railway off its bed. J.Thomson @ GNS Science From the air, the scarp of the southern branch of the Papatea Fault is seen to extend like a knife-cut across the shore platform. In this image you can sea the uplifted coastline extending into the distance. The total uplift of the area left (east) of the fault is 5 to 6 metres, whilst the area to the right was uplifted by a smaller amount. Water has been ponded up against the new fault scarp. J.Thomson @ GNS Science A helicopter view showing the scarp of the Papatea Fault close up (across the top of image). The fault movement is thought to have been mostly horizontal with about 2 metres of vertical uplift in addition. J.Thomson @ GNS Science The Papatea Fault scarp is a sheer wall about 2 metres high. J.Thomson @ GNS Science Part of the task for scientists is to measure the uplift along the coast. The high and low water marks make a useful reference point that can be surveyed against the new sea level positions. J.Thomson @ GNS Science Sadly the raised shoreline stranded innumerable sea creatures that now litter the area amongst the seaweed. J.Thomson @ GNS Science Rockfalls have been numerous, and have caused a lot of damage where the road and railway are squeezed up close to the coastal cliffs. J.Thomson @ GNS Science The end of the road? The reason why you won’t be travelling into Kaikoura from the north anytime soon. This rockfall is at the south end of Okiwi Bay, and there are more slips like this further south. There are several GeoTrip locations that you can visit to see the changed landscape along the Kaikoura Coast such as this one 

A Ruptured Landscape Read More »

Tracking Dinosaurs in NW Nelson

Greg Browne. Image Julian Thomson @ GNS Science In New Zealand there is only one area (with six individual locations not far from each other) in which dinosaur footprints have been identified. This is in NW Nelson in the South Island. They were discovered and researched by Greg Browne, a sedimentologist at GNS Science who has spent many years doing geological fieldwork in the area. The first announcement of their discovery was in 2009 as shown in this video. Dinosaur footprints near Rovereto, Italy. Image J Thomson When compared to the easily recognisable dinosaur trails that are found in other parts of the world, the structures that have been classified as footprints in New Zealand are not initially obvious.  The photo shows an example from near Rovereto in northern Italy where each footprint is about 30 cm across. Image Julian Thomson @ GNS Science In comparison, the New Zealand examples are irregular in shape and position. It took a lot of research and a process of elimination to be certain that these structures are indeed trace fossils of dinosaurs, rather than originating from another biological or mechanical cause..  In order to be able to point at a dinosaur origin for these impressions, there are several factors that have to be considered. As a starting point we can look at horses on a modern beach: Image: Van der Lingen, G.J. & Andrews, P.B This photo was taken by researchers who investigated horse hoof marks that were imprinted on a beach sand in New Zealand (from van der Lingen, G.J. & Andrews, P.B. 1979, Journal of Sedimentary Petrology). They carefully cut a vertical slice through the imprint to study the details of how the horizontal layers of sand were deformed by the weight of the passing animal. The hand lens shows the scale: Base image: Van der Lingen, G.J. & Andrews, P.B There are essentially three ways in which the original sediment has been affected:(A) – Jumbled particles and blocks of sand have  fallen into the depression made by the footprint.(B) The footprint has a clear vertical margin on either side(C) The sediment underlying the footprint has been compressed downwards.   It is most likely that these horse footprints were soon eroded after their formation in the late seventies, due to tides, storms, wind or even the action of shore creatures such as crabs, worms or shellfish. On the other hand, there is a small possibility that they were  preserved quickly beneath a new layer of sand and are still intact beneath this protective covering. Base image: Van der Lingen, G.J. & Andrews, P.B Over geological time, sediments such as these can become buried deeply, compressed into solid rock and later revealed by uplift and erosion at the modern land surface. In the case of the horse footprint, its appearence on the surface (in 2 dimensions)  would then depend on the amount and angle of erosion. For example, if it is were eroded near to the top of the footprint (the level of line 1 in the photo) it would appear relatively large compared to if the erosion had removed most of the material, and only the lower part of the footprint were showing (line 2). Similarly if a vertical section of the footprint were to  be exposed, its size and appearance would differ depending on whether the section that was revealed represented the centre of the footprint (3) or its edge (4). Image Greg Browne @ GNS Science Here is an example of one of the footprints that Greg identified in the Upper Cretaceous rocks of Nelson. It shows similar features in cross section to the horse footprint (at approximately the same scale)- the infilling (A), the distinct margin (B) and the compressed underlying layers (C). Image Greg Browne @ GNS Science Here is another example of a vertical slice through a footprint, with the dotted line highlighting the distinct margin of the structure: Julian Thomson @ GNS Science This photo shows a footprint eroded horizontally. The heel has cut a sharp edge into the sediment at the back end of the feature (lower left), while the front has been compressed into ridges as the foot tipped forwards during locomotion (near finger).   Having confirmed these features as footprints being preserved in sediment from an intertidal environment, the question then arises as to whether animals other than dinosaurs could have made them. Having tackled this question over many years, Greg Browne worked through the following possible examples and discounted them for the reasons given:  Fish feeding or resting traces: depth of penetration and lack of deformed strata below. Amphibian foot prints: unlikely to have an amphibian large enough. Bird foot prints: bird would have to be large and heavy. Mammals: the only pre-Pleistocene mammals known from New Zealand are Early Miocene mouse-like fossils. Evidence throughout the world indicates that Cretaceous mammals were small, and did not develop into large animals until after the end of the Cretaceous extinction event and the demise of the dinosaurs. Reptile foot prints: dinosaurs: only dinosaurs would be of sufficient size and weight to have generated these deformed point source compression structures. Recently, with funding from the Unlocking Curious Minds Fund of the Ministry for Business, Innovation and Employment (MBIE), a team from GNS Science were assisted by teachers and students of Collingwood Area School, to clean up a large rock slab in the search for more dinosaur footprints. With a lot of hard work, involving cleaning mudoff the rocks with buckets of water, brooms and shovels, some hitherto unseen dinosaur footprints were revealed for the first time since the Cretaceous Period, about 70 million years ago. Here are some quotes from our assistants:“It was a wonderful once-in-a-lifetime opportunity to work with a team of scientists and look at a real dinosaur footprints.” “It was an honor and very humbling knowing that we were the first people to see these footprints in 70,000,000 years.” “It was an incredible opportunity. We were able to work alongside

Tracking Dinosaurs in NW Nelson Read More »