A nature connection curriculum in Taiwan

Fresh water in Transylvania / J.Thomson In my view there are compelling reasons to increase the amount and quality of outdoor education in schools. We have an unprecedented environmental crisis that is accelerating the decline of ecosystems worldwide on the one hand, and a crisis of mental health, disconnection and loss of hope in many young people on the other. The Covid-19 Virus and its social, economic and political consequences is making our interdependence clear on so many levels, and challenging us to adapt in new ways to limit the spread of the pandemic whilst also maintaining positive relationships and attitudes. Atlas Moth in Thailand / J.Thomson It has been demonstrated that nature connectedness improves mental health and wellbeing and also increases the likelihood that the individual will make positive interventions that conserve nature. In other words, it benefits both the natural world and human wellbeing. Nature connectedness doesn’t just mean being surrounded by greenery, exercising in nature or going for holidays in beauty spots. It is an active engagement with nature through attention of the senses, connecting emotionally, seeing beauty and harmony, finding meaning in the natural world, and feeling compassion for all living things. (check out this article for more in-depth on the subject) I am in the Yilan Province of Taiwan, working with CiXin Waldorf School in Dongshan to enhance their outdoor education curriculum right through from Years 1 to 13, but focusing on the high school.   The goal is to use outdoor education to let the students grow in their self confidence, their physical and mental resilience, their agility to learn new things, their understanding of their place in the world and their nature connection. In this way we can hope that the students will move on into their lives with a sense of meaning, purpose and empowerment to participate in the world with confidence, offering unique strengths and value. My time with the school involves working with the teachers and administrators to develop a heightened vision for the outdoor programme, review the present offerings and explore opportunities to enhance or add to the various outdoor activities that are already in place. As part of this process I have been invited by the teachers to explore the region of the NE of Taiwan to help find opportunities for creating new outdoor learning experiences for the various classes. This video gives an idea of the forests that are not far from the school. We visited them one day to assess their potential for outdoor activities:

A nature connection curriculum in Taiwan Read More »

Why we need to find a way to reconnect with Nature

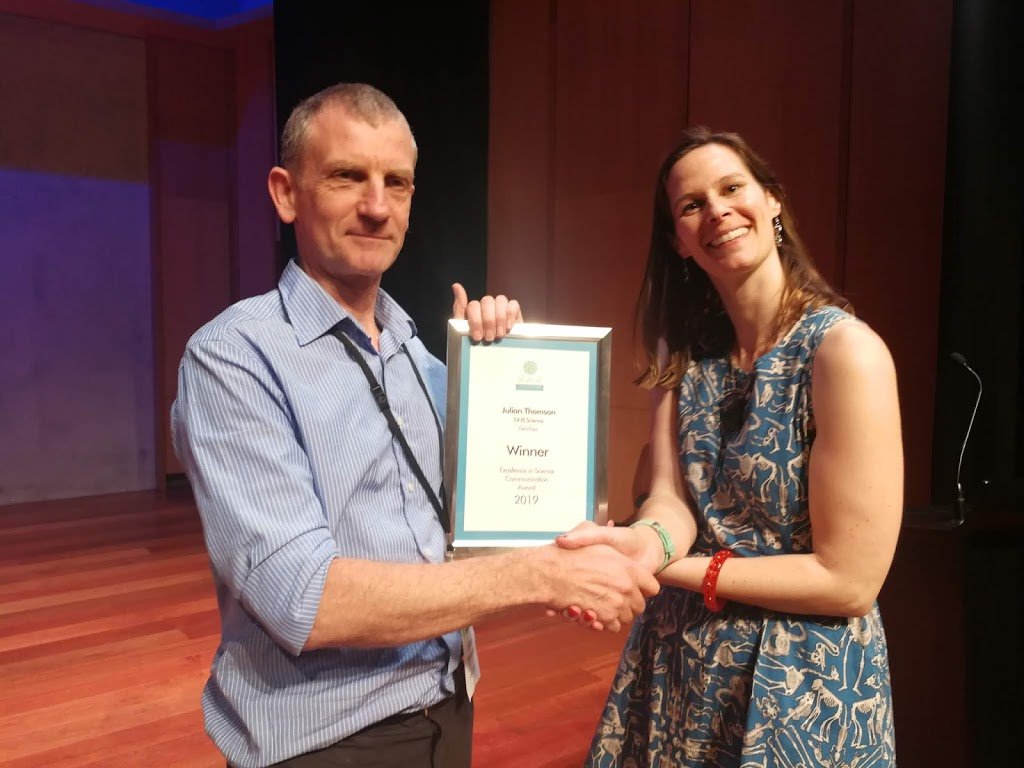
Receiving theSCANZ science communication prize for 2019

After 12 years living my dream job at GNS Science in New Zealand, I left the organisation in early January 2020 to become a self employed educational consultant and science communicator. So why leave GNS and expand my horizons? Here is my Why: There have been so many incredible highlights from my time being connected with GNS, going back as far as 2001 that I find it hard to write a full list, but here is a taster: running field trips for students and teachers all over New Zealand, including exploring glaciers in the Southern Alps, on the volcanoes and many other fascinating locations, being the logistics manager for the Alpine Ice Core project, drilling ice on several glaciers in the Southern Alps working in Antarctica as an educator for the ANDRILL sediment coring programme Being a script editor, science advisor and presenter for several TV documentaries shown to a worldwide audience Creating the GNS Science YouTube channel, by far the most popular video channel for any New Zealand university or Crown Research Institute Creating the GeoTrips website that shows interested non specialists where they can explore geological outcrops, landforms or informative displays. Science Communicators’ Prize for creating the GeoTrips website Visiting and exploring many fascinating locations in New Zealand and Indonesia to document the work of science teams out in the field, including areas affected by the Christchurch Earthquake, Kaikoura Earthquake, Volcanoes such as White Island, Tongariro, Ruapehu and the Auckland Volcanic Field. Discovering fossils in remote areas including an unknown species of fossil whale Best of all has been to get to know a huge range of teachers, scientists, students and others, many of whom I hope to continue to work with. In my new role I will continue to work independently with science organisations, schools and individuals who are interested to communicate about geoscience, ecology, education and adventure in the outdoors. Julian Thomson, Rangipo Desert with logs burnt by the Taupo Eruption,

Why we need to find a way to reconnect with Nature Read More »

Developing a nature and outdoor education programme in Taiwan

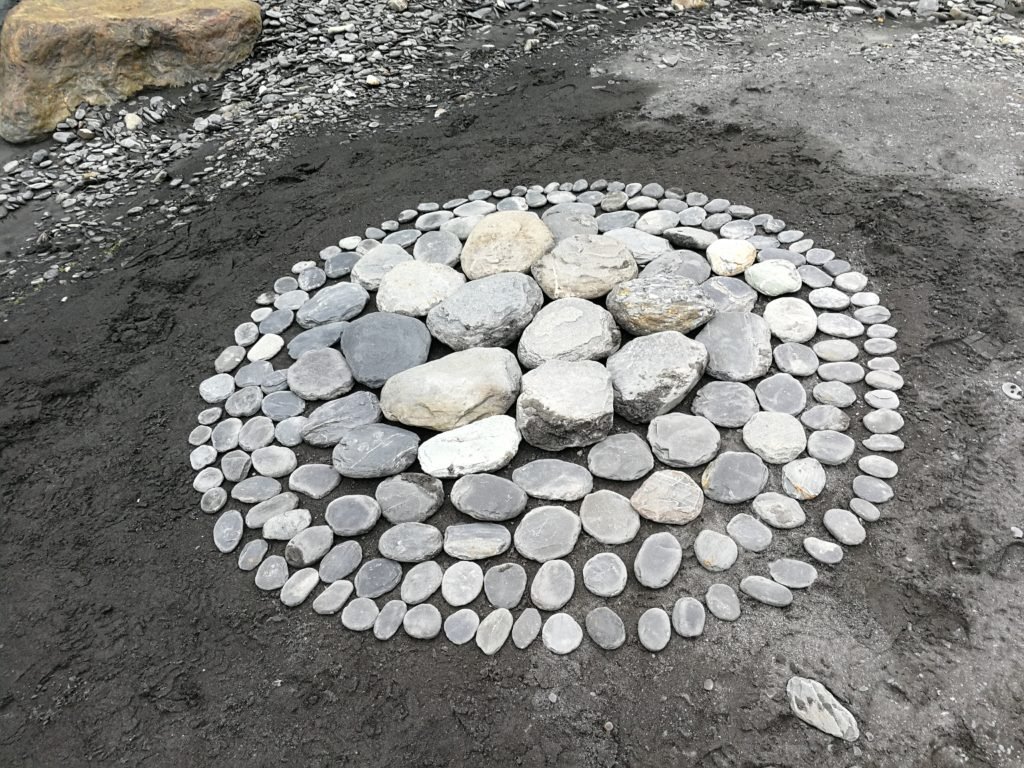
Stone circle art at Nanao River, NE Taiwan

I have been asked to work with a group of teachers and school administrators in Cu Xin school, Dongshan Township, Yilan, Taiwan, to help them develop and refine their nature and outdoor education programme in the high school. I will be there for the month of February 2020 and this will be the first visit, with possibly more to follow. The rationale for this initiative is that outdoor education can be designed to offer several benefits, including physical fitness, psychological challenge and resilience, aesthetic appreciation and scientific learning. One thing that interests me in particular is the relationship between being in or near to green spaces and natural environments; specific nature connectedness activities; psychological well-being and environmental action taking. These are topics that I will elaborate on at a later date. For now let me leave this video with you that is the way I see things in this space of education and nature:

Developing a nature and outdoor education programme in Taiwan Read More »

Nature Connectedness 2020

Julian being filmed for 'Beneath New Zealand' doco

After 12 years as the Outreach Educator and Science Communicator at GNS Science New Zealand, I am now an independent educational and science communication consultant. Behind this new move is a desire to focus my work on breaking down the barriers that inhibit people, especially young people, from getting outside, connecting, exploring, adventuring, discovering and enjoying everything that is to be experienced in natural environments. Visiting vs connecting with natureResearch is showing that those people who engage in nature by actually taking notice of the environment even to a limited extent, have measurable physical and mental health benefits. It has also been shown that nature connectedness – by using the senses, experiencing beauty, responding emotionally and compassionately increases the likelihood that people will make positive choices that conserve or enhance the environment. Connect people with nature to benefit both people and nature. How to explore nature?There are countless ways to increase nature connectedness. There are also many barriers that have become significant in our modern screen dominated urban lifetyles. What used to be the most self-evident and natural thing in the past – that people engaged with and spent lots of time in nature, has become something we have to do intentionally . Exploring the way to a new nature connection curriculumIn February I will be spending a month with teachers in Yilan Province, NE Taiwan, exploring the environment in the region of their school and helping design their high school outdoor education curriculum.

Nature Connectedness 2020 Read More »

Natural Hazards Science for East Coast Schools

Natural Hazards Activities for Schools This article is about a science education project that I was involved in that was supported by MBIE’s Unlocking Curious Minds fund in 2018. It involved four three-day natural hazards science camps for intermediate level students in New Zealand’s rural Tairawhiti (Gisborne – East Cape) region. A total of 109 year 7 and 8 students and 16 teachers, from 19 schools were represented. The science camps were based at four different locations (Gisborne, Te Karaka, Tolaga Bay and Ruatoria / Te Araroa) with the activities and field trips tailored to suit each area. The events included lots of field trips and hands-on problem solving tasks. Here for the record is a summary of some of the activities and also a few of the places we visited: Introductory activities included observation and thinking exercises around the theme of science and natural hazards. These included demonstrations such as: earthquake P (longitudinal) and S (transverse) waves using slinky springs. A TC1 seismometer was used to demonstrate how ground shaking (created by participants jumping on the floor) can be captured as a wave trace on a projector screen, giving a record of the magnitude (energy) and duration of the vibrations. The TC1 can be used by schools and individuals who wish to detect earthquakes and interact with other enthusiasts online as part of the Ru programme in New Zealand Rock deformation: Alternating layers of flour and sand in a transparent container show how rocks can be faulted and folded by compression of the earth’s crust. For information about this demonstration have a look this earthlearningidea.com page. For a bit of a hands-on problem solving challenge, participants were invited to create some model structures to protect an area fromcoastal erosion. The models were set up in shallow storage containers. Once the ‘seawalls’ were built, the area behind them was backfilled with sand, the containers tilted at a shallow angle, and water added to within about 15cm of the ‘sea wall’. Here is one example: Testing involved using a plastic lid to push the water in waves up against the seawall, first gently, then with increasing energy. Different designs could then be compared and strengths and weaknesses discussed.   Following this exercise we travelled to Wainui Beach, Gisborne where there has been a variety of attempts to protect the foredunes which have properties built on them. Interestingly, many of the methods that had been used were similar to those that the students thought of with their model making. Here you can see the remains of a concrete wall that has been undermined by wave erosion    Another similar model making exercise, this time including a slope of cardboard at one end, was to design rockfall barriers.  These were also tested to destruction using varying quantities and sizes of rocks rolled down the slope. We were also able to do another activity associated with flooding which has been a big issue this year in the Gisborne area.The photo shows the sediment covering some of the farmland near Te Karaka following the floods. For this activity, participants had to design a stop-bank, and test how long it could retain water, by recording any pooling of water on the ‘dry’ side , every 30 seconds. If you are an educator wanting information sheets to run these activities they can be found on the GNS Science website learning pages here. Here are some of the field locations that we visited, and what we investigated at them: At Pouawa Beach, north of Gisborne, we made careful drawings of some deposits that are thought to have been laid down by a tsunami. Shells in these layers have been radiocarbon dated at about 2000 years old. The layers include gravel and shells that would have been transported from the sea floor. Using a  drone we could get a good view the top of a marine terrace (the flat surface upper left of pic) at the north end of the beach. The terrace was formed at sea level as a wave-cut platform during the last interglacial (about 80 thousand years ago), and has been uplifted since its formation by tectonic activity. There is a wide shore platform which you can see just covered by water in the photo. Another great example is nearby at Tatapouri –  for more information check out the GeoTrip here – these surfaces will also be uplifted eventually to form another step in the landscape. These marine terraces show that earthquakes and tsunamis have a long history on the East Coast! At the north end of the beach. we passed a landslide that had occurred during the very wet weather in June 2018. From the ground we could see the toe of the slip which included tree trunks, boulders and lots of muddy sediment. With our drone, we were able to get a much more complete view of the slip, including the source area, which was not visible from where we were standing. This shows clearly the value of drone technology as a tool to extend our view of this active landscape: Next stop Tolaga Bay, where the beach has been covered by logs, brought down from the forestry plantations by the recent heavy rainfall. The logs caused a lot of damage to properties, bridges and land as they travelled down the flooded rivers. Here we spent some time analysing the types of logs scattered on the beach, by counting the different species (pine, poplar, willow or other) within 10m square quadrats. The results showed that by far the majority came from pine forestry. We were able to visit a forestry area inland of Tolaga Bay, which showed that following harvesting of the pine trees, there is a period of time where the land is vulnerable to erosion before the next generation forest grows large enough to stabilise the soil. Following clear-felling, the slash (abandoned logs and branches) can get washed into rivers during heavy rainfall. Further North still we did a day trip

Natural Hazards Science for East Coast Schools Read More »

Volcano City

Mangere Mountain, L. Homer / GNS Science Volcanic cones, explosion craters and lava flows form much of Auckland’s natural topography. All of these, apart from one (Rangitoto Island) are from vents that erupted once only (monogenetic), with eruptions lasting a few weeks or months and then ceasing completely.  There are many accessible and beautiful locations that can be visited to uncover the geological history of the area. Auckland volcanoes, GNS Science Although there are about 50 volcanoes within a 20km radius of the city, there is a similar eruption process that generated them, with three main possible styles of eruption. Knowing the difference between these eruption styles allows you to interpret the different features and rock types of each of the volcanoes that you might wish to explore. The magma that erupts in the Auckland Volcanic Field (AVF) is generated in a ‘hotspot’ about 80 to 100 kilometres below the surface. It is a very fluid type of basalt that is known to rise quickly to the surface (at up to 5km / hour) from the magma source. Tuff outcrop at North Head, J..Thomson / GNS Science Once at the surface, the style of eruption depends largely on the amount of groundwater or sea water present. If there is a lot of water near the vent, its interaction with the hot magma (1000 plus deg C) causes it to instantly vaporise.  This, along with the expansion of gases within the lava itself, creates extremely violent eruptions that fragment the lava into small particles and blasts them upwards and sideways from a wide, flat explosion crater. This becomes surrounded by a ring of ash. Such deposits are known as tuff (pronounced ‘toof’ as in ‘woof’). You can see outcrops of this in Auckland, for example around the shoreline at North Head. Each individual layer represents an explosion from the vent. Surtsey eruption, courtesy NOAA This type of eruption is known as a phreatomagmatic or wet eruption, and a classic example occurred off the coast of Iceland from 1963-67 when the island of Surtsey was born. Mount Eden Crater, J.Thomson / GNS Science Scoria outcrop, Mount Wellington, J.Thomson / GNS If the magma reaches the surface where there is little interaction with water there is a different type of eruption. This includes eruptions in areas of dry land, as well as those that start off as wet eruptions, but where the water supply near the vent gets used up before the supply of erupting magma runs out. The magma then erupts in a fountain of lava, driven up by gases within it that are expanding as the pressure is reduced.The lava fountains might be several hundreds of metres high, with blobs of lava partially solidifying in mid-flight, and landing as scoria in a ring around the vent. This is a bit like the froth coming out of a soda bottle once the lid has been removed.  The scoria pieces and lava bombs are relatively sticky and can build the steep sided cones that are very recognisable in the Auckland landscape. The reddish colour comes from the oxidation of iron in the magma as it cools during its flight through the air. Lava bomb approx 1/2 m in length, Mangere Mountain  If you look at the rock that makes up these cones, you will see that it is made of bombs and fragments that may be partially glued together or more or less loose and rubbly. Takapuna lava flow, J.Thomson / GNS Science If one of these eruptions gets to the stage where the gas has mostly been expelled, then there is less energy available and the fire-fountaining stage ends. Should the eruption continue (which is not always the case) then the third eruption style starts to dominate. Lava pours out of the vent and pushes through the sides of the scoria cone to spread out around the volcano. Because it is such a fluid type of lava, a  variety of flow structures are preserved when it finally solidifies. Lava tree mould with bark impression, J.Thomson / GNS A great example of such a lava flow can be found along Takapuna Beach. About 200,000 years ago lava poured out of the nearby Pupuki crater and flowed through a forest. The tree trunks and branches were surrounded by the lava which cooled around them. The trees then burnt, leaving tree shaped holes within the lava. Takapuna Fossil Forest and Rangitoto, J.Thomson / GNS For more information about where to go in Auckland to see some of these geological localities, have a look at our new online map of geological locations atwww.geotrips.org.nz Could a volcanic eruption occur in Auckland in the future? What are the probabilities in the short to medium term and what would the impacts be? The short answer to the first question is ‘Yes,  definitely!’ There is no reason to think that eruptions won’t occur again. In order to answer the last two questions (‘When?’ and ‘What?’) it is important to get as clear a picture as possible of the history of past events, their timing, duration and magnitude, and their geographic relationship to the housing and infrastructure in the wider Auckland area. Auckland Museum Volcanic Eruption Auckland City and Mount Victoria, J.Thomson / GNS These questions are the focus of a long term scientific programme called DEVORA (Determining  Volcanic Risk in Auckland). DEVORA is led by GNS Science and the University of Auckland, and is core-funded by the EQC and Auckland Council. The first part of this programme has been to further our knowledge of the eruption history of the Auckland Volcanic Field volcanoes. What this work has shown is that there is no simple pattern that we can project to help easily forecast the likelihood of eruptions in the future. The timeline of eruptions shows them to be clustered, with large gaps between phases of relatively high activity.  Graham Leonard, photo by Brad Scott / GNS Graham Leonard of GNS Science is a co-leader of the project. He comments

Volcano City Read More »

GeoTrips – visiting New Zealand’s geology and landforms

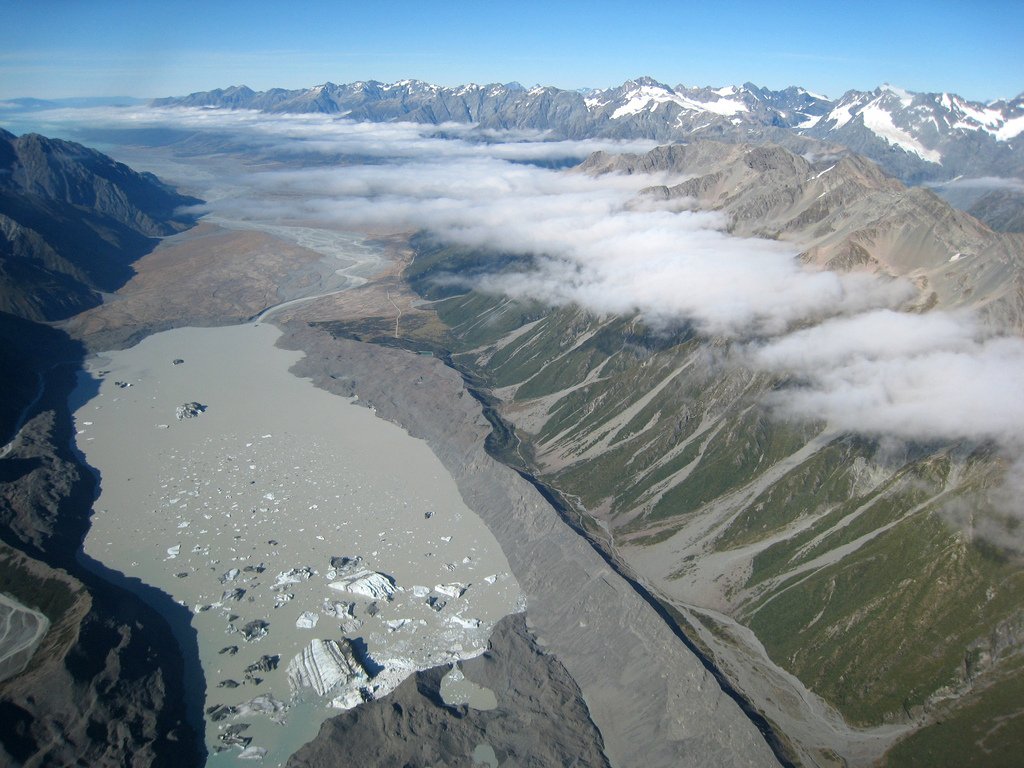
The Tasman Glacier Lake from the air

Tasman Glacier Lake,  J.Thomson / GNS Science New Zealand is an isolated country with a very active plate boundary running right through it. For a relatively small landmass it has an astonishing variety of landscapes and is being continuously subject to dramatic physical occurrences that include earthquakes, volcanic eruptions, floods, landslides, rapid erosion and sedimentation. The geology of New Zealand can be explored in innumerable individual localities that each give individual insights into the geological story, like pieces of a jig saw puzzle. In order to visit these locations, a non specialist normally has to seek information in widely scattered sources such as specialist papers, local guidebooks, various websites or visitor centres. Many of these are out of print or out of date, and hard to get hold of. To overcome this issue, GNS Science has created a New Zealand geological locations map that allows interested people (eg members of the public, researchers, teachers and students) to have the information they need to explore our geology first hand. The content is provided by geoscientists and is aimed to encourage you to go to these localities and make your own observations, just like scientists do. As well as some geological background, there are images, directions, and some basic safety and accessibility information too. You can search the map using filters to focus on specific topics, rating scales or accessibility.  So… have a look, explore and plan some trips to become a New Zealand geological investigator!  www.geotrips.org.nz  

GeoTrips – visiting New Zealand’s geology and landforms Read More »

Earth’s Magnetism in Antarctica

A blog post by Tanja Petersen and Neville Palmer from their recent GNS Science trip to Antarctica to measure the Earth’s Magnetic Field. It took 8 hours for the Hercules aircraft to fly from Christchurch to Williams airfield, a runway on the Ross ice shelf close to Scott Base. Both of us had never been to Antarctica before; we had a big smile on our faces when we stepped out from the airplane onto the ice being greeted by dry crisp cold air and what seemed like a never ending blanket of snow.  Read up on the Hercules – it is a quite fascinating aircraft and has been around since the 50s! The view from Crater Hill, a volcanic cinder cone on the foot hills of Mt Erebus, provides a fantastic overview of the settings of Scott Base. You can see Williams airfield (upper left corner); the boundary between the thick ice shelf and the thin sea ice meanders diagonally through the photo towards White Island in the distance. The pressure ridges on the sea ice are semi-circling the green painted buildings of Scott Base. 10pm at Scott Base. 24-hour sunlight! Looking out from the back towards the two geomag huts (left). We are here to measure the strength and direction of the Earth’s magnetic field at two locations in the Ross Sea area, Lake Vanda & Cape Evans, where people have been repeatedly measuring it since 1974 and 1911, respectively. And we also want to check up on our equipment inside the two little green huts outside the back of Scott Base, which is continuously recording the local variations of the Earth’s magnetic field.  The accommodation for the night at Scott Base: One of the many corridors inside Scott Base connecting the buildings of different sizes and shapes. Corner, stairs up, another corner, stairs down … a bit of a labyrinth for a newbie! Häglund snow vehicle to the left, Mt Erebus in the background, a toilet tent, two sleeping tents, some shelters built into the snow and a flag marking a safe route.The inside of Scott Base is being kept warm & cosy at T-shirt temperature, but outside it is more like -6 to -12 degrees C (including wind chill – important factor!). The Antarctic Field Training is giving us a good practice run on how to keep warm outside, before heading into the field. Antarctica New Zealand provided us with heaps of layers of warm clothes to wear. We then were ready to load up the helicopter that flies us from Ross Island to Lake Vanda, in the Dry Valleys, 125 km away on the Antarctic mainland. The Wright Valley with Lake Vanda in the distance. Our fieldwork in the Dry Valleys, Antarctica, begins. First thing is to set up the fluxgate magnetometer near the Lake Vanda camp, before we walk to the nearby repeat measurement sites to get readings of the strength and directions of the magnetic field. Neville is measuring the directions of the Earth’s magnetic field at Lake Vanda. In 1767 the South Magnetic Pole was located around here; now it is about 1720 km away. We are repeating these measurements several times over the course of four days. Tanja on a special mission – the “P bottle” is part of keeping the environment as we found it. After those four days working at Lake Vanda we continue to Cape Evans, Ross Island, Antarctica for a day. The historic magnetic hut there was constructed in 1911 as part of Scott’s Terra Nova expedition. It has asbestos in its wall panels; its structure is protected by a plywood construction around it. Inside that hut is the wooden pillar that Captain Robert Falcon Scott and his team of explorers used to take magnetic measurements before heading into their ill-fated expedition to the South Pole. Over 100 years later Neville performs the same type of measurements, but in a slightly different outfit. The Terra Nova Hut nearby. Captain Scott’s base for his explorations of the frozen continent, in the early 1900s. It was also used by Shackletons’s Ross Sea party. After completing our work successfully our flight back gets delayed and we have a bit of time for some recreational activities on the ice shelf close to Scott Base before heading home to New Zealand.

Earth’s Magnetism in Antarctica Read More »

Landslide Dam

Seaward Slide, J.Thomson @ GNS science Rockfalls and landslides were one of the dramatic consequences of the M7.8 Kaikoura Quake. This first photo shows one that is actually so huge that you might not at first recognise it for what it is. The white cliff in the distance is the landslide scarp and the huge green capped pile of grey in the middle distance is the debris that fell away. This landslide was of course made famous on TV by the cows that became trapped on an isolated hummock in the debris pile. SH1 and Railway, Steve Lawson @ GNS Science A large number of coastal cliffs collapsed, causing spectacular damage to the coastal transport infrastructure. In this image you can see how the raiway line has been lifted up and dropped across the road and across the beach. J.Thomson @ GNS Science Another example of rockfall damage along the coast: Hapuku Landslide, Steve Lawson @ GNS Science In the Canterbury ranges, a short distance inland, a number of landslides have blocked river valleys and created landslide dammed lakes that are now filling up. This image shows the massive Hapuku landslide, which has buried the valley in over 150 metres of debris, weighing many millions of tonnes. The grey coloured lake in the centre of the image is a couple of hundred metres long Hapuku landslide, J. Thomson @ GNS Science This is a close up view of the lake taken a few days later. The lake is now near to the point of overflowing the dam. The problem with these dams is that they can fail catastrophically, sending a debris flow of water, mud and rock down the valley with potentially very destructive consequences. Linton landslide survey, J.Thomson @ GNS Science In this image you can see another landslide, this time in the Linton Valley. It has also dammed a small river. The team here are surveying the debris and the shape of the valley in order to calculate the possible downstream consequences of a breach of the dam. Linton landslide, J.Thomson @ GNS Science This photo shows the size of the landslide.  A large section of forest has slid down with it with many trees still standing. The debris has again blocked the valley to form a lake. Linton landslide dam, J.Thomson @ GNS Science The lake level is still about 10 metres below the rim of the dam: Linton landslide dammed lake, J.Thomson @ GNS Science In order to measure the lake’s water level safely, Chris Massey took a GPS reading from the helicopter whilst it hovered just above the water surface. Linton landslide, J.Thomson @ GNS Science Meanwhile at the base of the dam, some water is percolating through the debris, although the flow in the stream bed is much less than usual: Linton landslide, J.Thomson @ GNS Science This photo shows the toe of the landslide – a mass of rock debris and damaged trees. Linton landslide, J.Thomson @ GNS Science By the end of a few hours, we had lots of data in the form of laser scans of the slip from different locations, as well as hundreds of drone and aerial photos, which are combined to make a 3D digital image that can be used to model the possible consequences of the dam breaching in different ways. This video made by Steve Lawson is a virtual ‘fly through’ of the digital model: And here is a short video about these landslide dams: Finally, there is more information about landslides on the GeoNet website here

Landslide Dam Read More »

The Kekerengu Fault

Photo Tim Little @ VUW Whilst there were many faults that ruptured during the recent M7.8 Kaikoura Earthquake, the Kekerengu Fault is perhaps the most awe inspiring in terms of its effect on the landscape and infrastructure. As it ripped through the countryside, it displaced the land to either side by an astonishing 8 to 10 metres sideways and about 2 metres vertically over many kilometres of its length. Kekerengu Fault offset, J.Thomson @ GNS Science In places this horizontal offset is even more – up to a whopping 12 m. This is impressive on a global scale. In the first two images here you can see what this looks like where farm tracks have been sliced through at a right angle. Here is a drone’s eye view from above: Kekerengu Fault,   J.Thomson @ GNS Science As the trace of the fault passes through different locations, it expresses itself in a number of ways. Across the river from Bluff Station, it has opened up an enormous crevasse, not unlike the sort of thing that mountaineers often see on a glacier. This will be due to either a slight bend in the fault trace, and/or slumping of the downhill side of the fault where there is a slope. Kekerengu Fault,   J.Thomson @ GNS Science Slickensides is the name given to the scrape marks  on the surface of the wall of a fault. Here you can see that they are dipping down at about 28 degrees from the horizontal (towards the south-west). This is useful information to help understand the direction of movement of the rupture, and tells us that this fault moved obliquely (sideways and up).  When we looked across the fault we could see that the land on the far side had moved to the right. It is therefore a ‘dextral’ or ‘right lateral’ oblique slip fault. Kekerengu Fault,   J.Thomson @ GNS Science Fences are really useful markers to allow measurement of the fault offset, especially when they cross the fault at close to 90 degrees.as in this photo. Yes – those two lines of fencing used to join up! Kekerengu Fault,   J.Thomson @ GNS Science The hillside here appears scarred by a simple knife cut… Kekerengu Fault,   J.Thomson @ GNS Science …whereas in other places, the slip is distributed over a broad area of surface deformation. In this case it is likely that the groundshaking helped the hillside follow the call of gravity to spread the deformation over a large area. Kekerengu Fault,   J.Thomson @ GNS Science Near to the coast, the Kekerengu Fault tracks across this field towards the main state highway and the railway. Here the fault trace is a mound of huge clods of earth and ripped turf. We call this a “mole track”, and it results from some compression rather than extension along this part of the fault trace. Kekerengu Fault,   J.Thomson @ GNS Science Not far away, State Highway 1 has been pushed sideways in several pieces… Kekerengu Fault,   J.Thomson @ GNS Science and the nearby railway has been pulled so hard that it snapped. Kekerengu Fault,   J.Thomson @ GNS Science The fault runs right under this small bridge which is totally destroyed. Kekerengu Fault,   J.Thomson @ GNS Science Lots of food for thought and plenty of work ahead for earthquake scientist Russ van Dissen and his colleagues.

The Kekerengu Fault Read More »