Landslide

Landslide Dam

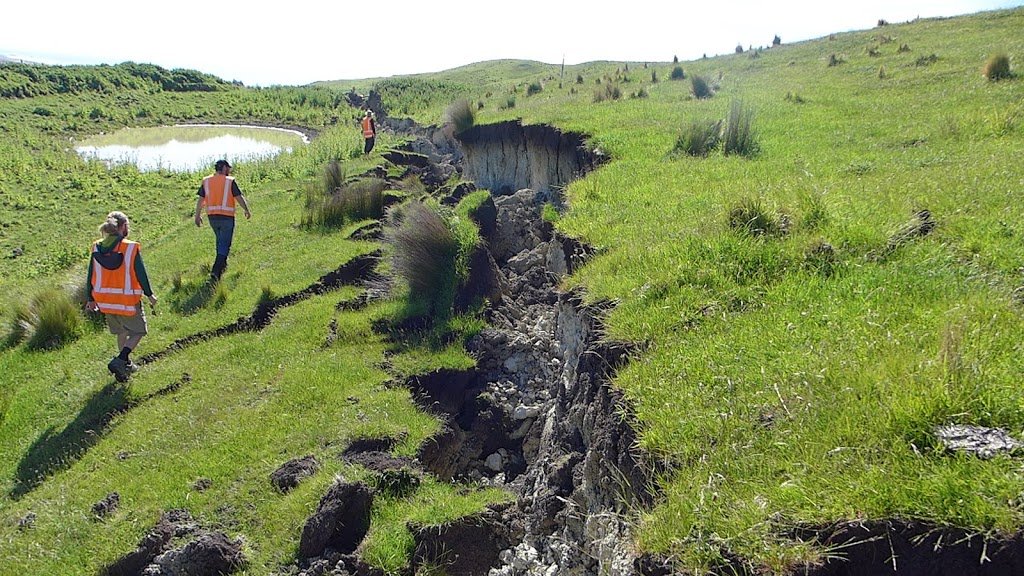
Seaward Slide, J.Thomson @ GNS science Rockfalls and landslides were one of the dramatic consequences of the M7.8 Kaikoura Quake. This first photo shows one that is actually so huge that you might not at first recognise it for what it is. The white cliff in the distance is the landslide scarp and the huge green capped pile of grey in the middle distance is the debris that fell away. This landslide was of course made famous on TV by the cows that became trapped on an isolated hummock in the debris pile. SH1 and Railway, Steve Lawson @ GNS Science A large number of coastal cliffs collapsed, causing spectacular damage to the coastal transport infrastructure. In this image you can see how the raiway line has been lifted up and dropped across the road and across the beach. J.Thomson @ GNS Science Another example of rockfall damage along the coast: Hapuku Landslide, Steve Lawson @ GNS Science In the Canterbury ranges, a short distance inland, a number of landslides have blocked river valleys and created landslide dammed lakes that are now filling up. This image shows the massive Hapuku landslide, which has buried the valley in over 150 metres of debris, weighing many millions of tonnes. The grey coloured lake in the centre of the image is a couple of hundred metres long Hapuku landslide, J. Thomson @ GNS Science This is a close up view of the lake taken a few days later. The lake is now near to the point of overflowing the dam. The problem with these dams is that they can fail catastrophically, sending a debris flow of water, mud and rock down the valley with potentially very destructive consequences. Linton landslide survey, J.Thomson @ GNS Science In this image you can see another landslide, this time in the Linton Valley. It has also dammed a small river. The team here are surveying the debris and the shape of the valley in order to calculate the possible downstream consequences of a breach of the dam. Linton landslide, J.Thomson @ GNS Science This photo shows the size of the landslide.  A large section of forest has slid down with it with many trees still standing. The debris has again blocked the valley to form a lake. Linton landslide dam, J.Thomson @ GNS Science The lake level is still about 10 metres below the rim of the dam: Linton landslide dammed lake, J.Thomson @ GNS Science In order to measure the lake’s water level safely, Chris Massey took a GPS reading from the helicopter whilst it hovered just above the water surface. Linton landslide, J.Thomson @ GNS Science Meanwhile at the base of the dam, some water is percolating through the debris, although the flow in the stream bed is much less than usual: Linton landslide, J.Thomson @ GNS Science This photo shows the toe of the landslide – a mass of rock debris and damaged trees. Linton landslide, J.Thomson @ GNS Science By the end of a few hours, we had lots of data in the form of laser scans of the slip from different locations, as well as hundreds of drone and aerial photos, which are combined to make a 3D digital image that can be used to model the possible consequences of the dam breaching in different ways. This video made by Steve Lawson is a virtual ‘fly through’ of the digital model: And here is a short video about these landslide dams: Finally, there is more information about landslides on the GeoNet website here

Landslide Dam Read More »

A Ruptured Landscape

J,.Thomson @ GNS Science On the ground in the Kaikoura Quake aftermath: Following the recent M7.8 Kaikoura Earthquake, a number of teams of scientists have been deployed to survey the geological impacts and assess the potential ongoing risks to people and infrastructure. This gallery of images shows some of the numerous dramatic impacts of the quake in the coastal area to the north of Kaikoura.  J.Thomson @ GNS Science Accessing the area by road involves careful driving. The road surfaces next to many of the bridges have subsided, creating a crack at either end of the bridge:  J.Thomson @ GNS Science Slumping has occurred along parts of the highway:  J.Thomson @ GNS Science This photo shows the now famous house at Bluff Station that had the mis-fortune to be built directly on top of the Kekerengu Fault. The house was shunted about 7 metres sideways leaving some of its foundations behind. J.Thomson @ GNS Science  The house was pushed across its own driveway… J.Thomson @ GNS Science  The coastal highway and railway have unfortunately been cut through in several places by fault ruptures. This view looking south at Waipapa Bay shows the northern branch of the Papatea Fault crossing SH1 and heading out to sea. J.Thomson @ GNS Science This is what the road now looks like on the ground. The fault scarp has been bulldozed to allow vehicle access. J.Thomson @ GNS Science A short distance away, the railway line was lifted up and dropped in the grass next to its original gravel bedding. J.Thomson @ GNS Science From the top of the fault rupture, you can see that the displaced railway tracks extend for about 300 metres into the distance. Will Ries @ GNS Science A few hundred metres further south, the southern branch of the Papatea Fault crosses the road and railway. J.Thomson @ GNS Science The earthquake ripped right through the concrete culvert that ran under the road, and again lifted the railway off its bed. J.Thomson @ GNS Science From the air, the scarp of the southern branch of the Papatea Fault is seen to extend like a knife-cut across the shore platform. In this image you can sea the uplifted coastline extending into the distance. The total uplift of the area left (east) of the fault is 5 to 6 metres, whilst the area to the right was uplifted by a smaller amount. Water has been ponded up against the new fault scarp. J.Thomson @ GNS Science A helicopter view showing the scarp of the Papatea Fault close up (across the top of image). The fault movement is thought to have been mostly horizontal with about 2 metres of vertical uplift in addition. J.Thomson @ GNS Science The Papatea Fault scarp is a sheer wall about 2 metres high. J.Thomson @ GNS Science Part of the task for scientists is to measure the uplift along the coast. The high and low water marks make a useful reference point that can be surveyed against the new sea level positions. J.Thomson @ GNS Science Sadly the raised shoreline stranded innumerable sea creatures that now litter the area amongst the seaweed. J.Thomson @ GNS Science Rockfalls have been numerous, and have caused a lot of damage where the road and railway are squeezed up close to the coastal cliffs. J.Thomson @ GNS Science The end of the road? The reason why you won’t be travelling into Kaikoura from the north anytime soon. This rockfall is at the south end of Okiwi Bay, and there are more slips like this further south. There are several GeoTrip locations that you can visit to see the changed landscape along the Kaikoura Coast such as this one 

A Ruptured Landscape Read More »

Mount Cook Rockfall

Hooker Valley rockfall. – Simon Cox / GNS Science On the evening of Monday 14th July there was a large rockfall from the western slopes of Mount Cook into the Hooker Valley.   Staff from the Department of Conservation and GNS Scientist Simon Cox flew over the area  to make assessments of the  impact. The first photo shows the view towards Mount Cook with the dark shadow of the rockfall splaying out onto the Hooker Glacier on the left. Photo J Spencer / DoC Approaching the area, the scale of the rockfall starts to become apparent. As well as the debris fan there is a wide expanse of dust that settled on the opposite wall of the valley. Photo Simon Cox / GNS Science The devastated area of mountainside that was swept by the avalanche is well over a kilometre across. Photo Simon Cox / GNS Science Because of a prominent ridge in the path of the rockfall, the debris divided into two separate lobes as it poured down the mountain. This photo shows the smaller, upper branch and the white ridge (known as Pudding Rock) that obstructed the torrent of rock and ice debris. In the foreground is the dust covered icefall. Photo Simon Cox / GNS Science This is a view of the area from higher up, looking down the valley. Simon estimated that roughly 900 000 cubic metres of rock debris are scattered on the valley floor, having travelled  up to 3.9 kilometres and fallen a vertical distance of 1600 metres. On its journey down the mountain, the avalanche scooped up possibly three times as much snow and ice which mixed with the rock material. Photo Simon Cox / GNS Science A view upwards towards the low peak of Mount Cook, showing the source area and path of the rock avalanche Photo: DoC / J Spencer  Amazingly, the Gardiner Hut just avoided obliteration due to its favourable location on the tip of Pudding Rock. However it was badly damaged.   Photo: DoC / J Spencer The toilet block was crushed and the hut pushed off its foundations. Luckily no-one was inside. Photo DoC / D Dittmer Clinging to the mountain amongst a sea of debris. The Gardiner Hut was in the best possible position to (almost) avoid destruction in this rockfall event. Photo DoC / D Dittmer Finally here is a view of the headscarp with the 300 metre high x 100 – 150 metre wide grey rockfall scar on the cliff face, the source of all the devastation. You can visit the end of the Hooker Glacier, one of the spectacular day walks at Mount Cook: Here is the GeoTrips link: www.geotrips.org.nz/trip.html?id=685

Mount Cook Rockfall Read More »

The Dart Landslide

Simon Cox   GNS Science M. McSaveney GNS Science Slip Stream is a tributary to the Dart River in the South Island of New Zealand. There has been an active landslide here for several thousand years, periodically sending down lobes of debris to gradually build up a large fan in the Dart Valley. There was vegetation established right across the fan, but over the last few years the widespread cover of trees has been largely buried and killed off by a very active phase of erosion and deposition. Debris volumes of the order of 100 000 cubic metres have been coming down during heavy rains in the spring and summer periods. Simon Cox  GNS Science The debris gets mobilised into a wet mix of mud and boulders.  The latest large event occurred early in this month (4th January 2014), and the flows continued to build up over several days. M. McSaveney GNS Science The debris flows crossed right over the valley, blocking the Dart River with a low angled, shallow pile of soft sediment. M. McSaveney GNS Science A lake formed in the valley above the slip, becoming about 4 kilometres long. The river is cutting down into the debris, and it is expected that the depth of the lake will fluctuate during landslide activity. The Department of Conservation is diverting the affected part of the Dart Valley track so that trampers can continue to visit the area. Photo DoC/Vladka Kennett This image gives a good overview of the affected area.  It shows the fan with the darker coloured triangle of recent debris, as well as the length of the lake. This is a graph from the Otago Regional Council website showing 7 days’ rainfall recorded from the 9th to 16th January at the Hillocks, about 24 kilometres down the Dart Valley from Slip Stream. The second graph shows how the river flow responded to the rain, with a sharp peak and a gradual tailing off after the rain stopped falling. The tail is not entirely smooth with a dip when the flow gets below 100 cubic metres per second. This suggests that when the river level drops, the continuing input of debris at the slip impedes the flow for a while, until the blockage is overcome and the flow rate increases again. Mark Rattenbury (left), Simon Cox (right) and Mauri McSaveney (behind the camera) visited the area to assess the impact and any possible downstream hazard. Note that a special DOC permit is required to visit Slip Stream as it is in the sacred Te Koroka topuni area of Mount Aspiring National Park.  The slip is in a state of continual instability and the area is hazardous. In this video Simon explains some of the interesting features of the slip, including some very strange bubbles that release dry dust when they burst:

The Dart Landslide Read More »

The Changing Height of Mount Cook

Mount Cook  rock avalanche 1991. Lloyd Homer, GNS Science On 14th  December 1991 a massive rock avalanche occurred from the East Face of Aoraki /Mount Cook, sending an estimated 14 million cubic metres of rock in a 1.5 kilometre wide cascade across the grand plateau and down onto the Tasman Glacier. It is thought that the avalanche travelled at speeds of 400 to 600 km per hour, and the resulting seismic recording at Twizel, 75 km away, lasted well over a minute, registering the equivalent of a magnitude 3.9 earthquake. Mt Cook Dec. 1991.  M. McSaveney, GNS Science Prior to the avalanche the surveyed height of New Zealand’s highest peak was 3764m. The Department of Survey and Land Information (now LINZ) calculated that this was reduced by 10 metres after the summit fell off with the rock fall. As you can see from the photo, the peak became extremely narrow and unstable. In the image taken by GNS geomorphologist Mauri McSaveney a few days after the event. A lone climber that can be seen as a tiny dot inside the red circle  gives some idea of the scale. The “new” summit was obviously highly unstable, and would be subject to quite rapid erosion following the rockfall. Since 1991, there has been no re-calculation of the revised elevation of 3754m until recently. At the end of November 2013, I flew up to Plateau Hut with a climbing team who planned to take direct GPS measurements of the summit ridge of the mountain, a short distance from and a few metres below the highest point. The measurement would then be used to validate a computer model made from recent aerial photos to give a precise calculation of the present height of the peak itself. The team was made up of (left to right): Geoff Wayatt, mountain guide; Nicolas Cullen from Otago University; Brian Weedon, mountain guide; Pascal Sirguey (project leader) from the National School of Surveying at the University of Otago; Jim Anderson from Survey Waitaki and myself. Geoff, Brian, Nicolas and Jim made up the climbing team. GNS Science provided support in terms of the helicopter flights.  I was able to accompany the team to Plateau Hut where I spent two days gathering a visual record whilst they were involved in their climb. Mount Cook East Face   Julian Thomson, GNS Science The plateau of Mount Cook is arguably the most spectacular alpine setting in New Zealand. This image shows the 1500m high East Face of Mount Cook in the early morning light seen from Plateau Hut. The normal route up the mountain follows the Linda Glacier, starting on the right hand side of the image and following into the shadow behind the long low angled rock ridge (Bowie Ridge) up to the summit rocks. As well as Mount Cook itself, the Grand Plateau has views of many other summits along the main divide, including Silberhorn, Tasman and Dixon. This image shows the top section of Syme Ridge on Mount Tasman. There are three climbers just visible on the ridge just above the centre of the photo, about 10 hours into their climb from the hut. This image shows the patterns of crevasses on the grand plateau, just above the Hochstetter Icefall. Plateau Hut at night.  Julian Thomson, GNS Science The climbing party left Plateau Hut just after midnight with clear, cold weather conditions that were perfect for the climb. Mt Cook Summit Rocks, Photo Geoff Wayatt Aoraki / Mount Cook is a challenging peak to climb, with very dynamic glaciers and steep rock and ice faces to negotiate. In this photo, the climbers are in the ice gullies that run through the summit rocks. Photo Nicolas Cullen View from the summit, with Mount Tasman in the background Photo Nicolas Cullen Looking along the summit ridge of Aoraki / Mount Cook, with the two GPS units in place. The very highest point is about 45 metres distant. The GPS units measured a height of 3719 metres at their position. This measurement was consistent with the height from the computer model which then allowed the height of the high peak to be calculated as 3724 metres above mean sea level. This means that Aoraki / Mount Cook is a full 30 metres lower than the 1991 estimate of its height, showing that the mountain peak has continued to erode significantly during the last 22 years. There is more information about the project at the Otago University School of Surveying website. Here is our video of the expedition : Mountaineers staying at Plateau Hut can get an incredible 360 view of the surroundings from nearby glacier dome. We have even created a GeoTrip for the location:  www.geotrips.org.nz/trip.html?id=450

The Changing Height of Mount Cook Read More »

Earthquake impacts in Marlborough seen from the air

Dougal Townsend of GNS Science was part of a team that flew over Marlborough to assess the impact of the recent earthquakes on the landscape and infrastructure. Although relatively minor compared to those that impacted the Christchurch area in 2010 and 2011, there were nonetheless some isolated, but significant effects. All these photos were taken by Dougal: Here you can see damage (cracking) to State Highway 1 between Seddon and Ward (near Caseys Road turnoff) following the Lake Grassmere Earthquake. Large landslide in the Flaxbourne River catchment (about 8.5 km west of Ward). Another Large landslide. This is  in Miocene mudstone, just south of Cape Campbell. A whole section of the hillside has slipped Bell’s dam near Seddon. Damage (cracking) was sustained during the Cook Strait Earthquake and was exacerbated during subsequent aftershocks and also during the Lake Grassmere Earthquake. The channel was dug to partially drain the dam, to lessen potential flood risk to the town of Seddon, which is 10 km downstream to the NE. A closer view of the cracks along the top of Bell’s dam. alongside the vehicle track This image shows rock fall on a farm track about 2 km southeast of Ward (track goes up to Weld Cone). The rock is Late Cretaceous sandstone and siltstone.  Ground damage in Needles Creek, west of Ward. Cracking of the farm track (centre left) is from the Lake Grassmere Earthquake, whereas the minor landsliding of the terrace gravels on the right may be from a combination of storm (rainfall) and earthquake (ground shaking) damage. 

Earthquake impacts in Marlborough seen from the air Read More »

Lake Tutira – tectonic uplift, ice ages, landslides and cyclones

Lake Tutira is a scenic spot on the route between Napier and Wairoa in northern Hawkes Bay. It is in a very rural setting, surrounded by steep hillsides and farmland. The landscape around the lake contains several powerful geological stories. The first is that the hills themselves, made up of rocks that are about 1.8 million years old, reach a height of up to 800 metres above sea level. Before being uplifted and exposed by erosion, the rocks may have been buried to depths of 500 to 1000 metres. This means that they have been rising at an average rate of about a metre every 1000 years. When you look at this steep hillside, you can see lines of cliffs running almost horizontally across the slopes. These bluffs are made of relatively hard limestone, with softer muds and sandstones hidden beneath the grassy slopes separating the cliffs.The top limestone band that you can see correlates with the one on the top of Waipatiki Beach that I showed in a recent post. These cliff lines therefore represent the cycles of global change that repeated every 40000 years. The hard limestones were deposited as sea levels were slowly rising, while ice caps melted at the end of each glacial period, as shown also in my previous posts from Waipatiki and Darkeys Spur. The next landscape feature of interest is this area of grassy hummocks just beyond the pine plantation. These are the debris pile from a massive landslide that slid down from the nearby hills about 7200 years ago. It blocked the stream that flowed down the valley, thus forming the present day Lake Tutira.  Similar huge rock slides occurred in other parts of the region at the same time. Scientists believe that they may have all been triggered by a single massive earthquake. One of our activities on the recent ‘Dinosaurs and Disasters Geocamp” with Hawkes Bay schools was to drill a sediment core from Lake Tutira. Kyle and Richard used a PVC drainpipe which they pushed into a shallow part of the lake bed. Although only about half a metre in length of core was extracted, you can clearly see a number of layers. The top of the core is to the left of the photo, with several organic rich layers visible. The lower half consists of varying amounts of pumice that will have been washed into the lake from where they accumulated after the Taupo eruption 1800 years ago. The lakefloor sediment has in fact been studied in detail by researchers from GNS Science and other institutions . In 2003 a drill rig was set up that retrieved a 27 metre core right through to the base of the sediments. It revealed a detailed history of the environment around Lake Tutira over the last 7200 years: Almost 1400 storms were intense enough to leave their traces in the form of layers of mud washed down from the surrounding hills. Periods when storms were more common started abruptly and could last for several decades. Volcanic eruptions from the Taupo Volcanic Zone (including the well known ‘Taupo Eruption’ of 1800 years ago)  have left layers of ash that can be dated. Changes in land use from native forest to pasture due to human occupation, have increased the sedimentation rates tenfold.. During Cyclone Bola which passed over Hawkes Bay in 1988, over 750 mm of rain fell over four days.  A huge number of mudslides came off the hillsides over the whole region. In this photo, Richard Levy and I have exposed a buried soil layer next to Lake Tutira. It is beneath about metre of pale brown ‘Cyclone Bola Mud’  (top half of image). The dark soil layer below contained branches of wood. Further down there was another pale coloured mud layer from an earlier rainstorm.

Lake Tutira – tectonic uplift, ice ages, landslides and cyclones Read More »

Rockfalls and slips in Christchurch

This week I have been with Garth Archibald, surveying areas in Christchurch that have been affected by rockfalls and slips. These surveys provide data which is used to calculate the stability of cliffs and slopes, and this provides useful information to planners and geotechnical engineers. At Redcliffs, Garth set up his laser scanner to make a 3D scan of the rock face. Houses in this area suffered catastrophic damage from rockfall during the February 22nd quake. Click here to listen to Radio NZ’s Morning Report interview with Garth at work at Redcliffs. The laser scanner sends out about 11000 laser pulses per second. The time it takes for the light to be reflected back to the scanner, gives a very precise measurement of the distance to each point, allowing Garth to make high resolution scan images. He will compare the results with those of a previous survey to see if any areas of the cliff are bulging or tipping over, if cracks are opening up, or if there have been any further rock falls. Another area we worked in was part of Hillsborough where a large area of hillside slipped during the earthquake. This time we used a GPS (Global Positioning System) unit to precisely locate several points. These are being re-surveyed regularly to better understand the nature of the slip. In this photo Garth is setting up the GPS base station at a survey point well clear of the slipped area. In the final photo, Garth is taking a GPS reading at the lower end of the slip. Here the ground has been compressed, and you can see how it has ridged up along the driveway. The fence has also buckled by the compression. .

Rockfalls and slips in Christchurch Read More »