Plate Boundary

What’s on our Plates?

Researching tsunami deposits on the East Coast

New Zealand has thousands of active faults each of which will produce an earthquake of some magnitude when it ruptures. However the two giants are the Alpine Fault and the Hikurangi Subduction Fault. They each form a segment of the plate boundary – the Alpine Fault can be traced across land, the length of the South Island, whilst the Hikurangi Subduction Fault is lying in wait under the Eastern part of the North Island, with its surface trace hidden deep underwater along the bed of the Hikurangi Trough and Kermadec Trench. Kekerengu Fault rupture in Nov 2016 (J.Thomson / GNS) Each of these plate boundary faults is capable of causing a massive earthquake greater than magnitude 8, thereby wreaking major destruction and disruption across New Zealand. It makes sense then that a lot of research effort is going in to understanding the past history of these faults. This allows us to gain insight into the probabilities of future ruptures and the sorts of impacts that could occur when one or the other of them next produces a big ‘quake. It also makes sense that if you are living in New Zealand, you should be interested in learning about how the scientists go about their research and what they have been discovering! What’s On Our Plates? is a set of free multimedia learning modules designed to enable anyone to explore Aotearoa New Zealand’s active plate boundary online, including the Alpine Fault and Hikurangi Subduction Zone. The modules are for any interested non specialist who would like to know more about out Plate Boundary research, but they also include notes for teachers who would like to use them as an educational resource. So get ready to dig in to the fascinating story of our two colliding tectonic plates. You can access the modules here.   The resource has been created by a collaboration of AF8 (Alpine Fault Magnitude 8) and East Coast LAB (Life At the Boundary). AF8 is undertaking a comprehensive study of the impacts a rupture of the Alpine Fault would have on infrastructure and the people living in communities across the South Island. It is a collaboration between the South Island Civil Defence Emergency Management (CDEM) groups and scientists from six universities and Crown Research Institutes, emergency services, lifelines, iwi, health authorities and many other partner agencies. The programme is managed by Emergency Management Southland. East Coast LAB (Life at the Boundary) is also a collaborative programme. It brings together scientists, emergency managers, experts and stakeholders across the East Coast to help us better understand and prepare for the natural hazards such as earthquakes and tsunami that may affect us. https://youtu.be/L8UXkQmbHZw

What’s on our Plates? Read More »

Raised Beaches at Tora

Raised beach ridges at Tora

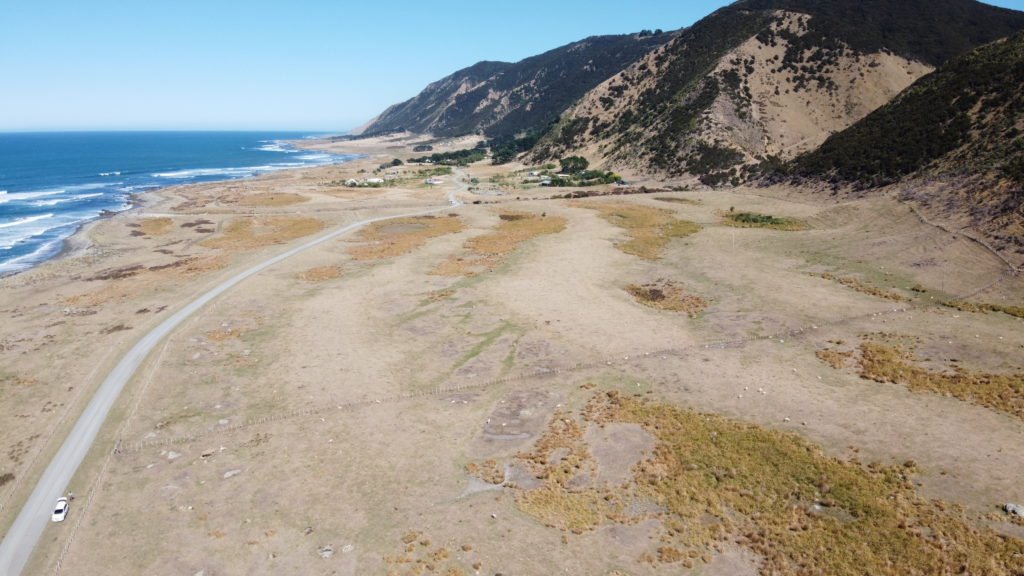
Tora is a small rural community on the Wairarapa Coast of the North Island of New Zealand. There are many interesting geological outcrops and landforms in the area. For me the most spectacular of these are in the area of sloping farmland just south of where the inland road meets the coast. On a recent trip to the area to scope out some school field trips (which were unfortunately cancelled due to the Covid-19 lockdown) I was able to take some images from the air with my drone. They show a series of light and dark parallel stripes running between the shoreline and the steep hillside about 200 to 300 metres inland. The light coloured stripes are ridges, with hollows in between that are picked out by the darker coloured swampy vegetation. These ridges were formed during storms along the beach, when large waves heaped up the rocks into a storm ridge just above high tide level. The reason there are several ridges in a sequence is that earthquakes have pushed up the land periodically, causing the active ridge to become isolated above shore level as the sea retreated to start creating a new ridge. This means that the oldest ridge is furthest inland, up against the hillside and the youngest ridge is presently active along the shore. There are at least 6 abandoned ridges that can be identified, with a seventh in the making at the top of the present day beach. Between the ridges are areas of low lying land that drains poorly, hence the swamp plants within these hollows. It is believed that the sea was up against the hill slopes about 7,000 years ago so that tells us that there is very roughly one earthquake uplift event every 1000 years. The fault responsible for these uplifted beach ridges (the Palliser-Kaiwhata fault) is about 5 to 8 km offshore and is about 60km long.It is a reverse fault where the west side (landward side) thrusts up and over the eastern (seaward) side. Kate Clark of GNS Science sent me this LIDAR image of the area which shows the uplifted beach ridges really clearly. LIDAR is a 3D laser scanning technique that creates images that exclude the vegetation cover and therefore show up the ground surface in incredible detail. The image shows the shoreline from lower left to upper right with the lines of the raised beach ridges between the sea and the prominent hills. Here is a short video I made to explain these features that you may be interested in checking out:

Raised Beaches at Tora Read More »

Imaging the Crust beneath Wellington

Having had a close up look to the surface trace of the Wairarapa Fault (see recent post here), I thought it would be interesting to find out the latest about what such a major geological structure looks like below the earth’s surface. Stuart Henrys and colleagues at Victoria University, the University of Tokyo, Japan, and the University of Southern California, USA, have been busy working on the results of the SAHKE project that ran a large scale seismic survey across the Lower North Island in 2011. The purpose of this survey was to  gain a better understanding of the anatomy of the plate boundary and associated structures below the Lower North Island. This image shows the line of the survey that not only ran across the land surface, but also extended across the sea floor to West and East. Thousands of measurements were recorded, creating a huge dataset that had to be processed to create two dimensional seismic cross sections. SAHKE seismic survey. Stuart Henrys @GNS Science Here is an example of how about 80 kilometres of the section can be displayed to highlight some of the structures in the crust down to 35 kilometres depth SAHKE seismic survey. Stuart Henrys @GNS Science It takes a lot of work to be able to interpret the information to see some of the major structures. You can see that a coherent band of energy deeper than 20 km depth is interpreted to be the plate boundary and descends at a very shallow angle, Also how the Wairarapa and Wellington Faults show up as narrow bands of energy that become low angle thrusts from about 15 kilometres below the surface Stuart Henrys @GNS Science This is a simplified summary of the complete 250 km length of the SAHKE seismic survey: Initially the plate boundary dips at a very shallow angle below the Lower North Island. This angle steepens below the west coast (Kapiti). The blue area is rock that has been scraped off the surface of the Pacific Plate and stuck (“underplated”) onto the base of the Australian Plate. You can think of the Australian Plate acting a bit like a chisel as it scrapes the top off the Pacific Plate in this way, pushing the overlying crust upwards along the Wellington and Wairarapa Faults to give rise to the Rimutaka and Tararua Ranges.  The diagram also shows (in red) where the plate interface is locked (down to about 30 kilometres depth) and the (green) area where it produces slow slip events. Find out more about the potential for very large earthquakes to be generated on Wellington’s Stuck Plate Boundary and also about Slow Slip Events. Tararua Range,  J.Thomson@GNS Science The narrow, long form of the mountains of the Lower North Island may be related to their position above  where the plate boundary dives more steeply downwards with underplated sediments  pushing the ranges up. Cross section of SAHKE seismic survey. Stuart Henrys @GNS Science Here is a more detailed image for you to explore if you are interested, showing some examples of earthquake locations (grey dots) in relationship to the crustal structures: UPDATE 5th Feb 2015:  Have a look at this media release about further groundbreaking discoveries resulting from this research project – “Scientists discover slippery base on underside of Pacific Plate”

Imaging the Crust beneath Wellington Read More »

Shooting the SAHKE Seismic Survey across the North Island

The blasts from the seismic survey were detectable by GeoNet as very small local ground tremors along the seismic line last week:                    PRELIMINARY EARTHQUAKE REPORT                             GNS SCIENCE                         GeoNet Data Centre                      Lower Hutt, New Zealand                      http://www.geonet.org.nz        The following earthquake has been recorded by GNS Science:        Reference number:        3511346/G       Universal Time:          12 May 2011 at 10:24       NZ Standard Time:        Thursday, 12 May 2011 at 10:24 pm       Latitude, Longitude:     41.15°S, 175.38°E       Location:                10 km south-east of Featherston       Focal depth:             0 km       Richter magnitude:       2.3        Web page: http://www.geonet.org.nz/earthquake/quakes/3511346g.html Man-made explosion as part of a science experiment in lower North Island                                                                            *         *         *  Here is a video in which Stuart Henrys explains the seismic survey :

Shooting the SAHKE Seismic Survey across the North Island Read More »

SAHKE – Seismic Array Hikurangi Experiment

About a dozen field teams have been out over the weekend  deploying geophones along the 90 kilometre transect of the SAHKE seismic survey. The first photo shows some of the Orica contractors  loading and priming one of the transect shot holes. 500 kilogrammes of explosive emulsion is being pumped down a 50m bore hole. The pile of gravel in the foreground is used to back fill the hole on top of the explosives. The idea is that the shock wave is directed downwards into the earth rather than up into the air.  (Photo by Stuart Henrys) It is very important that every geophone is in perfect working order and set up in exactly the right way, as  there will be no possibility of repeating the survey if anything goes wrong. The second photo shows Stuart Henrys, project co-ordinator, with some of the equipment being prepared at GNS Science, Lower Hutt. Getting all the equipment set up and deployed is a huge organisational feat. Stuart is holding one of the many hundreds of geophones that will be embedded in the ground along the survey line. Apart from the New Zealand participants (Victoia University and GNS Science), a large amount of equipment and expertise is being contributed by the Earthquake Research Institute at Tokyo University, Japan, and the University of Southern California The map shows the actual location of the seismic survey line, with the positions of the shot holes indicated as stars. Depending on the time required for putting all the geophones in place, the detonations will be set off overnight during this week. The explosions are detontated at night to avoid too much interference from vibrations caused by traffic on the roads. When the geophones are deployed they have to be pushed into the ground so that they are well embedded. This ensures a solid contact. In this photo by Margaret Low (Photo Librarian at GNS Science) Vaughan Stagpoole is burying one of the 900 geophones alongside a road in the Wairarapapa. Check out our time-lapse of the busy science teams preparing the equipment for the SAHKE survey. Two days compressed into just over a minute to the music of Lykke Li!

SAHKE – Seismic Array Hikurangi Experiment Read More »

Wellington’s Stuck Plate Boundary

Ever since 1855, when New Zealand’s largest ever recorded earthquake (magnitude 8.1) shook the Wellington Region, a lot of effort has gone into understanding the earthquake risk in and around New Zealand’s capital city. There are several large fault lines in the area, including the Wellington Fault. This is the most active fault of the system, and stands out clearly, passing along the Hutt Valley and right through Wellington City itself. For more background information check here or watch this video. However, the largest fault of all, the interface between the Pacific and Australian Plates, underlies the whole region. The two dimensional map shows  the line of the boundary between the plates east of the North Island. In three dimensions, it is a sloping boundary (known as a subduction zone), with the Pacific Plate dipping under the Australian Plate. Plate collision is occurring at an oblique angle rather than head on, which is why there is such a large component of strike slip (sideways) motion in the North Island Fault System. The hidden, subsurface plate boundary has been mapped over the years using evidence from thousands of small or medium sized earthquakes generated on or nearby to  it. Seismometers are used to locate these earthquakes, and the seismic waves give information about the geological structures and rock types that make up the two interacting plates. Under Wellington the boundary dips gently down to the North-West at an angle of about 9 degrees, and is about 25 kilometers deep under the city. Over New Zealand there is a widespread array of GPS stations continually monitoring their location with great precision. This station is set up in the Tararuas, not far north of Wellington and the Hutt Valley. Scientists also carry out GPS campaigns to make repeated measurements at a large number of locations when they want more detailed coverage. Over time these recordings show that the surface of the landscape is being deformed by tectonic movements. These measurements indicate that a large segment of the crust of the Australian Plate in the Lower North Island is stuck to the underlying slab of Pacific Plate, and is being dragged along to the west faster than the Hawkes Bay or East Cape areas. There have been different reasons for this proposed by scientists, but it is believed to be caused mainly by friction on the interface between the two plates. It is very important for us to develop our understanding of the nature of this plate interface and the earthquakes that it produces, as subduction zone ruptures potentially create the most destructive earthquakes and tsunamis worldwide. The recent earthquake in Japan is one such example. In this coloured image, the red colour indicates a high “slip rate deficit” or high degree of coupling between the subducting and overriding plates in the Lower North Island. This segment of stuck plate boundary is about 70 km wide and 140 km long.  If it ruptured it would produce an earthquake of magnitude 8 or above. It is even possible for larger sections (eg the length of the North Island) to rupture occasionally in a single massive earthquake. For more information about the locked plates under the North Island, check out our website here. In order to improve our knowledge of the plate boundary, a major GNS Science co-ordinated project is being carried out next week. This involves a 90 km seismic survey crossing the lower North Island from one side to the other. Instead of listening out for natural earthquakes, the survey will use explosives, detonated down boreholes, to produce the seismic waves. Hundreds of geophones, spaced 100 metres apart, will pick up reflected sound waves to map the plate interface, faults and other features in the crust. Scientists from GNS Science, Victoria University, Tokyo and California are collaborating in this project. For some more background to this project, have a look at our media release, or listen to Tim Stern of Victoria University in this radio interview.

Wellington’s Stuck Plate Boundary Read More »

Kermadec Arc Videos

Our expedtion to explore the hydrothermal activity and mineralisation of the Kermadec arc volcanoes is now over. We arrived back in Auckland yesterday, after a successful three week research cruise. Amongst the discoveries that were made were areas of present day and ancient hydrothermal activity, relatively fresh lava flows from previously uninvestigated volcanic craters, and possibly some new species of deep sea life, yet to be verified. Hundreds of geological and biological samples were collected, along with thousands of images of the sea floor, and innumerable sonar, magnetic and gravity measurements. The volcanoes surveyed included Clark, Rumble III, Rumble II West, Healy and Brothers.  Rob Stewart of NIWA took the image of a squid that was pulled up by one of the sled tows. It is only a few centimetres long. These videos will give you some idea of the methods used and the findings of our Kermadec Expedition 2011: As a final image, here is a photo of our last sunset of the voyage as we steamed towards Auckland. It had many of us captivated as we stood on the deck admiring the changing colours:

Kermadec Arc Videos Read More »