Active Fault

What’s on our Plates?

Researching tsunami deposits on the East Coast

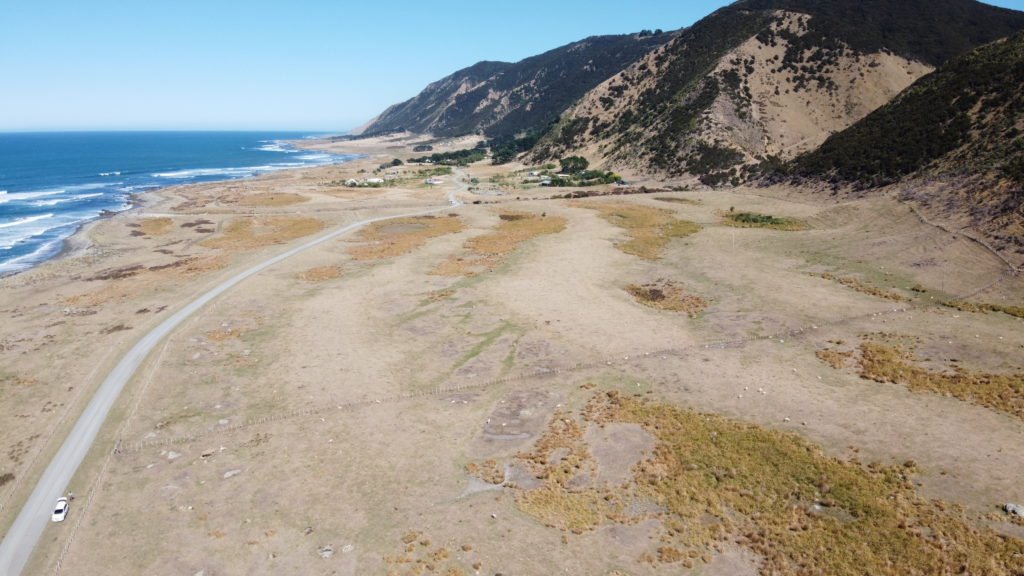
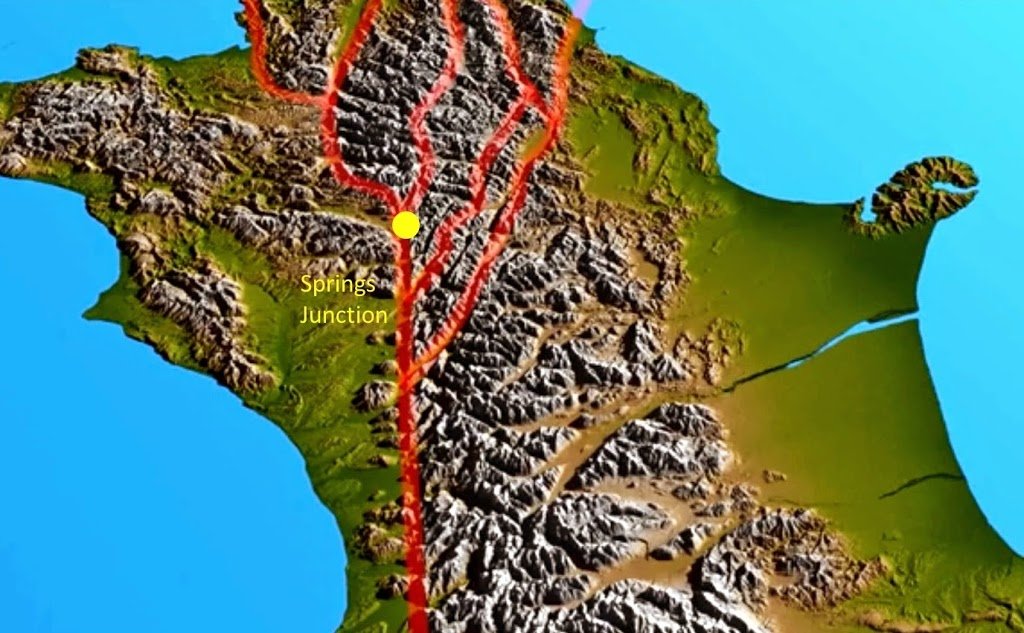
New Zealand has thousands of active faults each of which will produce an earthquake of some magnitude when it ruptures. However the two giants are the Alpine Fault and the Hikurangi Subduction Fault. They each form a segment of the plate boundary – the Alpine Fault can be traced across land, the length of the South Island, whilst the Hikurangi Subduction Fault is lying in wait under the Eastern part of the North Island, with its surface trace hidden deep underwater along the bed of the Hikurangi Trough and Kermadec Trench. Kekerengu Fault rupture in Nov 2016 (J.Thomson / GNS) Each of these plate boundary faults is capable of causing a massive earthquake greater than magnitude 8, thereby wreaking major destruction and disruption across New Zealand. It makes sense then that a lot of research effort is going in to understanding the past history of these faults. This allows us to gain insight into the probabilities of future ruptures and the sorts of impacts that could occur when one or the other of them next produces a big ‘quake. It also makes sense that if you are living in New Zealand, you should be interested in learning about how the scientists go about their research and what they have been discovering! What’s On Our Plates? is a set of free multimedia learning modules designed to enable anyone to explore Aotearoa New Zealand’s active plate boundary online, including the Alpine Fault and Hikurangi Subduction Zone. The modules are for any interested non specialist who would like to know more about out Plate Boundary research, but they also include notes for teachers who would like to use them as an educational resource. So get ready to dig in to the fascinating story of our two colliding tectonic plates. You can access the modules here.   The resource has been created by a collaboration of AF8 (Alpine Fault Magnitude 8) and East Coast LAB (Life At the Boundary). AF8 is undertaking a comprehensive study of the impacts a rupture of the Alpine Fault would have on infrastructure and the people living in communities across the South Island. It is a collaboration between the South Island Civil Defence Emergency Management (CDEM) groups and scientists from six universities and Crown Research Institutes, emergency services, lifelines, iwi, health authorities and many other partner agencies. The programme is managed by Emergency Management Southland. East Coast LAB (Life at the Boundary) is also a collaborative programme. It brings together scientists, emergency managers, experts and stakeholders across the East Coast to help us better understand and prepare for the natural hazards such as earthquakes and tsunami that may affect us. https://youtu.be/L8UXkQmbHZw

What’s on our Plates? Read More »

Raised Beaches at Tora

Raised beach ridges at Tora

Tora is a small rural community on the Wairarapa Coast of the North Island of New Zealand. There are many interesting geological outcrops and landforms in the area. For me the most spectacular of these are in the area of sloping farmland just south of where the inland road meets the coast. On a recent trip to the area to scope out some school field trips (which were unfortunately cancelled due to the Covid-19 lockdown) I was able to take some images from the air with my drone. They show a series of light and dark parallel stripes running between the shoreline and the steep hillside about 200 to 300 metres inland. The light coloured stripes are ridges, with hollows in between that are picked out by the darker coloured swampy vegetation. These ridges were formed during storms along the beach, when large waves heaped up the rocks into a storm ridge just above high tide level. The reason there are several ridges in a sequence is that earthquakes have pushed up the land periodically, causing the active ridge to become isolated above shore level as the sea retreated to start creating a new ridge. This means that the oldest ridge is furthest inland, up against the hillside and the youngest ridge is presently active along the shore. There are at least 6 abandoned ridges that can be identified, with a seventh in the making at the top of the present day beach. Between the ridges are areas of low lying land that drains poorly, hence the swamp plants within these hollows. It is believed that the sea was up against the hill slopes about 7,000 years ago so that tells us that there is very roughly one earthquake uplift event every 1000 years. The fault responsible for these uplifted beach ridges (the Palliser-Kaiwhata fault) is about 5 to 8 km offshore and is about 60km long.It is a reverse fault where the west side (landward side) thrusts up and over the eastern (seaward) side. Kate Clark of GNS Science sent me this LIDAR image of the area which shows the uplifted beach ridges really clearly. LIDAR is a 3D laser scanning technique that creates images that exclude the vegetation cover and therefore show up the ground surface in incredible detail. The image shows the shoreline from lower left to upper right with the lines of the raised beach ridges between the sea and the prominent hills. Here is a short video I made to explain these features that you may be interested in checking out:

Raised Beaches at Tora Read More »

Where to explore the Wellington Fault

Wellington Fault at Thorndon

The Wellington Fault is one of several large active faults in the lower North Island of New Zealand. From the Tararua Mountains and Kaitoke it runs the length of the Hutt Valley, the edge of Wellington Harbour, through Tinakori in the City and across the hills to Cook Strait. Earthquakes occur on the Wellington Fault approximately every 700 to 1000 years on average, with the last between 170 and 370 years ago. The probability of a rupture in the next 100 years is calculated to be about 10%. Because it runs along the highly populated Hutt Valley and right through the Capital City via its transport bottleneck, it is regarded as one of the country’s highest risk faults. You can find out information about all of New Zealand’s known active faults on the GNS Science Active Faults Database, but in this image you can see a screen grab of those known in the Wellington area, some of them labelled: As you can see there are many other faults in the region, each of which is capable of rupturing, so that the real possibility of a large earthquake occurring at some point from one or other of the faults is something that should inspire everyone to be prepared. (Make some time to go to https://getready.govt.nz/ ) As you can see there are many other faults in the region, each of which is capable of rupturing, so that the real possibility of a large earthquake occurring at some point from one or other of the faults is something that should inspire everyone to be prepared. (Make some time to go to https://getready.govt.nz/ to get the best information on how to do this.) Here is an aerial view of the Wellington Fault trace (bottom right to centre top of the photo) passing through California Park in Upper Hutt and along the centre of  California Drive beyond In neighbouring Harcourt Park, the fault crosses a flight of river terraces at a right angle. This allows us to see clearly that the slip (movements) on the fault are mostly horizontal with some vertical movement as well. Looking across the fault the opposite side moves to the right. This means that the fault is a “dextral oblique slip fault”.   This diagram shows how the Harcourt Park River Terraces are offset by the Wellington Fault The fault can be followed along the Hutt River. In Lower Hutt it runs right along the side of Hutt Road, and into Petone. This photo shows the fault scarp at the end of Te Mome Road where it meets Hutt Road at a T junction:   The entrance to Wellington City at Thorndon is a bottleneck, where the Wellington Fault passes underneath the railway, State Highway and Ferry Terminal, as well as the water supply. This makes Wellington vulnerable to being cut off by a rupture of the Wellington Fault. You can learn more by visiting the Wellington Fault at several points from Upper Hutt to Wellington. Check out this video for details:  

Where to explore the Wellington Fault Read More »

The Kekerengu Fault

Photo Tim Little @ VUW Whilst there were many faults that ruptured during the recent M7.8 Kaikoura Earthquake, the Kekerengu Fault is perhaps the most awe inspiring in terms of its effect on the landscape and infrastructure. As it ripped through the countryside, it displaced the land to either side by an astonishing 8 to 10 metres sideways and about 2 metres vertically over many kilometres of its length. Kekerengu Fault offset, J.Thomson @ GNS Science In places this horizontal offset is even more – up to a whopping 12 m. This is impressive on a global scale. In the first two images here you can see what this looks like where farm tracks have been sliced through at a right angle. Here is a drone’s eye view from above: Kekerengu Fault,   J.Thomson @ GNS Science As the trace of the fault passes through different locations, it expresses itself in a number of ways. Across the river from Bluff Station, it has opened up an enormous crevasse, not unlike the sort of thing that mountaineers often see on a glacier. This will be due to either a slight bend in the fault trace, and/or slumping of the downhill side of the fault where there is a slope. Kekerengu Fault,   J.Thomson @ GNS Science Slickensides is the name given to the scrape marks  on the surface of the wall of a fault. Here you can see that they are dipping down at about 28 degrees from the horizontal (towards the south-west). This is useful information to help understand the direction of movement of the rupture, and tells us that this fault moved obliquely (sideways and up).  When we looked across the fault we could see that the land on the far side had moved to the right. It is therefore a ‘dextral’ or ‘right lateral’ oblique slip fault. Kekerengu Fault,   J.Thomson @ GNS Science Fences are really useful markers to allow measurement of the fault offset, especially when they cross the fault at close to 90 degrees.as in this photo. Yes – those two lines of fencing used to join up! Kekerengu Fault,   J.Thomson @ GNS Science The hillside here appears scarred by a simple knife cut… Kekerengu Fault,   J.Thomson @ GNS Science …whereas in other places, the slip is distributed over a broad area of surface deformation. In this case it is likely that the groundshaking helped the hillside follow the call of gravity to spread the deformation over a large area. Kekerengu Fault,   J.Thomson @ GNS Science Near to the coast, the Kekerengu Fault tracks across this field towards the main state highway and the railway. Here the fault trace is a mound of huge clods of earth and ripped turf. We call this a “mole track”, and it results from some compression rather than extension along this part of the fault trace. Kekerengu Fault,   J.Thomson @ GNS Science Not far away, State Highway 1 has been pushed sideways in several pieces… Kekerengu Fault,   J.Thomson @ GNS Science and the nearby railway has been pulled so hard that it snapped. Kekerengu Fault,   J.Thomson @ GNS Science The fault runs right under this small bridge which is totally destroyed. Kekerengu Fault,   J.Thomson @ GNS Science Lots of food for thought and plenty of work ahead for earthquake scientist Russ van Dissen and his colleagues.

The Kekerengu Fault Read More »

Digging into the Alpine Fault

The Alpine Fault has been the focus of a lot of research over recent years, including the Deep Fault Drilling Project, Alpine Lake Sediment Research and the Earthquake Records at Hokuri Creek amongst them. These are building a much clearer picture of the history of previous fault ruptures, and allowing better estimates of the size and likelihood of future earthquakes. The Alpine Fault is a long, straight, geologically  fast moving fault that typically produces very large earthquakes rupturing along large segments of its total length. At its northern end the Alpine Fault branches into a number of different faults that cross Marlborough and are known as the Marlborough Fault System. This means that here the Alpine Fault only takes up a proportion of the total displacements in this region and is likely to have a different earthquake history compared to thecentral and southern parts of the fault. Recently a GNS Science expedition to the northern part of the Alpine Fault near Springs Junction, involved digging two trenches across it to better understand its local earthquake history through some careful investigation. This location features as one of our GeoTrips that you can visit. www.geotrips.org.nz/trip.html?id=59 . This image shows the trenches (left of centre foreground) from the air. The trace of the Alpine Fault passes through the trenches and into the distance between the hills. Once the trench has been dug out,  the walls need to be cleaned up carefully so that the fine detail of the different sediments and structures can be observed and recorded. A string grid is pinned against the walls of each trench to help map them out, and markers are placed to highlight significant features that can sometimes be very hard to discern. The leader of this project is Rob Langridge, shown here having a close look at the detail. Many hours are spent drawing accurate maps of the trench walls as well as taking high resolution panoramic images of them. These are taken in order to document the excavation so that later interpretation of the data can continue once the trench has been filled up and the team has returned to the office. This image shows the Alpine Fault in section with the line of the fault shown.  The scarp or slope at the ground surface has been produced by earthquakes uplifting the left hand (eastern) side.You can also see the effect of fault movements on the river sediments below the ground. The grey clay layer on the left has been cut off at the fault and the overlying gravel layer has been dragged out of shape by repeated fault movements. This is a close up view showing the complexity of the sediments and structures close to the fault. When earthquakes uplift ground on the left side of the fault, loose material at the surface collapses across the fault and forms a wedge shaped pile of sediment on the ground called a colluvial wedge.These earthquake associated layers later get buried by younger material. They can be very hard to identify, but are a critical record of past ruptures. They can form repeatedly, so that wedges from earlier earthquakes may have more recent colluvium laid over the top of them. Once the colluvial wedges have been identified, the next step is to look for plant or animal material that has been trapped in them at the time they were created. These carbon rich specimens are carefully collected for dating in the lab using the radiocarbon dating method. (See below for a video that explains carbon dating) When a major fault ruptures during an earthquake, it can branch out near the ground surface to produce a number of smaller faults close to the main fracture. Here is an example that showed up in the trench wall a few metres from the main fault. The layers on the right have been pushed up  relative to those on the left. By carefully observing which layers have, or have not been affected by these secondary faults, the earthquake record can be further clarified. Once all the data and specimens have been gathered and logged, the trenches are filled in once more so that the surface can revegetate back to its original state. Here is a 3 minute video of the project: And this video explains radiocarbon dating: Finally click here for the TVNZ news report on the trenching.

Digging into the Alpine Fault Read More »

Phase 2 Alpine Fault Drilling

Rupert Sutherland with DFDP-2 flags Whilst researchers continue to pull together the history of past Alpine Fault earthquakes, the Deep Fault Drilling Programme is well underway in Whataroa on the West Coast of the South Island. For an introduction to this project have a look at my blog and video here, or check out the DFDP-2 Facebook page or project leader Rupert Sutherland’s blog for updates over the next few weeks. The first phase of the drilling process was to penetrate down through a thick sequence of gravel and mud left behind in the Whataroa Valley after the retreat of ice at the end of the last ice age. This was surprisingly challenging because of a thick sequence of very sticky mud that was deposited in the valley at a time when it was a deep fiord or lake. DFDP-2 drill site   J.Thomson@GNS Science Eventually the team struck bedrock 240 metres below the surface, and the second phase could commence. This involves drilling down towards the fault plane, thought to be about a kilometre below the rig, without trying to retrieve any large intact pieces of the rock at this stage. (That process is the goal of phase three, which will start when the geologists see from the minerals in the rock fragments that the drill is closing in on the Alpine Fault.) DFDP-2 drill site   J.Thomson@GNS Science This is a view of the drill site on a nice morning with Phase 2 well established and the drill at a depth of 340 metres. Behind the rig you can see the drilling mud ponds. The science labs are on the right and spare drilling rods that are added as the drill gets deeper are in the foreground. The labsin the background are where the scientists  study the rocks being brought up by the drill, and make geophysical measurements taken by equipment that is lowered down the borehole. Close up to the rig you can see the vertical drill rod (or pipe) that is rotating and gradually descending down the drill hole. The next rod is lined up ready for connecting when the drill is a few metres deeper. The speed of drilling is roughly 1 to 4 metres an hour at this stage, and a new drill rod is added about every 6 hours. Next to the drill is this pond of muddy water, which is a vital part of the system used for cutting down into the rock. The mud is specially formulated to have the right viscosity and density and is sucked up by a very powerful pump. After having large particles sieved out of it, it is sent down the centre of the drilling pipe right down to the cutting face of the drill bit. The drill bit on the right has cut through about a hundred and twenty metres of bedrock, and is about to be replaced by the nice shiny one on the left. The drilling mud is forced out of the holes that you can see, and then flows up the outside of the drill pipe back to the surface, bringing with it the rock chips and also carrying heat away from the cutting face at the same time. This is the base of the drill rig, with a section of the rotating drill pipe visible. Drilling mud is flowing down the centre of it on its way down to the drill bit. After its return journey on the outside of the drill pipe, loaded with rock fragments, it emerges at ground level and is carried away in the pipe that extends to the right. The drilling mud flows into a collection pond. The sieve that you see is for collecting samples of the rock fragments for analysis. The samples are first carefully washed of fine mud or clay. They are then sorted by hand. After being glued to a microscope slide, the rock samples are ground down to a thickness of 30 microns. They are then transparent and can be analysed using an optical microscope. The mineral content can then be studied in detail. As the drill gets closer to the fault, the scientists expect to be able to see changes in the types of minerals present. In this way they will be able to judge the right time to change the drilling system to phase 3 and start retrieving intact rock cores. DFDP-2 drill site   J.Thomson@GNS Science Finally here are a couple more views of the DFDP-2 drill site looking up the Whataroa Valley. DFDP-2 drill site   J.Thomson@GNS Science

Phase 2 Alpine Fault Drilling Read More »

Jumping Faults

The Alpine Fault is divided into several segments based on changes in its tectonic structure and earthquake history along the plate boundary. The northern end of the Alpine Fault is much less straightforward in comparison to the southern and central sections. This is in the area where other faults of the Marlborough Fault System branch off the Alpine Fault and take up a large amount of the total slip. There is still a lot to find out in terms of their combined earthquake histories and how these faults interact in relation to each other. In 1964, a concrete wall was built across part of a paddock next to the Maruia River, near Springs Junction (see yellow dot on the map above). The wall is 24 metres long, about 1.5 metres high, and at first sight seems pointless, standing alone and unconnected with any other structure. I visited this location recently with Rob Langridge, earthquake scientist at GNS Science, 50 years after the wall was built. If you would like to go there have a look at our GeoTrips website: www.geotrips.org.nz/trip.html?id=59 The wall was built directly across the Alpine Fault by scientists who wanted to test whether it would be gradually pulled apart by slow sideways creep along the fault. As you can see – it has suffered no damage due to any gradual movement since it was built.This very clear finding is in accordance with our present understanding that most New Zealand active faults are locked. They do not gradually creep between rupture events, but do all their moving in sudden jumps – during earthquakes. Right next to the experimental wall, there is an overgrown stream channel that has been offset sideways by about 10 metres along the line of the fault. Some years ago, a series of pits were excavated to assess the age of the offset river features. In one pit a piece of buried wood was found and then radiocarbon dated, showing that the surface is about 1200 years old. This means that the 10 metre offset has occurred since this time, giving an annual slip rate (rate of movement) of the alpine fault about 8 mm at this location.  This compares with about 27mm per year for the central and southern sections of the Alpine Fault, further south. The last rupture here at Springs Junction in about AD 1600 offset a nearby river terrace by about 1.5 metres. This suggests that at least two earthquakes will have accumulated the 10 metres of offset of the stream channel.

Jumping Faults Read More »

A Ticker Tape Record of Alpine Fault Earthquakes

The famous NASA image of New Zealand’s South Island clearly shows the trace of the Alpine Fault along the straight western edge of the Southern Alps. This oblique Google Earth view of the West Coast shows the relative uplift on the eastern side of the fault that has created the Southern Alps. The Hokuri Creek location indicated on the image is the site of a very important record of Alpine Fault earthquakes going back for the last 8000 years. A significant feature on this part of the fault is that it has actually been uplifting on its western side, instead of to the east as it does along most of its length. These diagrams show how the amazing record of earthquakes was created at Hokuri Creek. The first picture shows how the low fault scarp blocks the stream, ponding the water and creating a swamp. This gradually fills up with carbon rich plant material (peat) so that eventually the surface of the swamp becomes level with the top of the scarp and the river flows straight across it. When an Alpine Fault earthquake occurs, the fault uplifts by about a metre, creating a space into which the creek brings loose rock debris (gravel, sand and silt) washed down the river from landslides caused by the groundshaking. A new swamp develops once the land stabilises until the peat layer again reaches the level of the top of the scarp. Another Alpine Fault earthquake uplifts the scarp, and a new earthquake debris layer is deposited, adding another record to the fault rupture history. The great thing about peat layers is that they provide plenty of carbon material for radiocarbon dating.The time of past earthquakes is at the horizon where the peat changes upward into landslide derived sand and silt, so by taking samples at this layer, the earthquakes can be dated. At Hokuri Creek, by a quirk of fate, the river found a new outlet several hundred years ago, eroding downwards and exposing the sequence of peats and earthquake debris layers like pages in a book.This does mean however that the record of the two or three most recent earthquakes is not available here. You can see how  scientists used a ladder to access good sampling points. Amazingly, they were able to trace 24 earthquakes going back over the last 8000 years. Records of the two or three most recent ‘quakes, missing from this sequence, have been found in a more recent study at the nearby John O’Groats swamp. Scientists were able to recover several sediment cores there that complete the sequence. Carbon dating gives a date range within which the most likely date is at the peak of the probability curve. (To understand radiocarbon dating have a look at this GNS Science video. ) The dating results that you can see on this graph show how the Alpine Fault at Hokuri Creek has been rupturing in a very regular cycle over the last  8000 years. The intervals do vary – from 140 to 510 years, but the average is 330 years. In fact the most common actual interval between Alpine Fault earthquakes is 300 years, which is sobering when you realise that the last Alpine Fault rupture was in 1717, just under 300 years ago. EQ histories compiled by U.Cochran@GNS Science To give you some idea of the significance of this Alpine Fault history, here is a comparison with three other major transform faults. This shows clearly how the Alpine Fault exhibits by far the most regular earthquake behaviour of a big fault anywhere in the world. This map shows the location of Hokuri Creek in the southern section of the Alpine Fault. The earthquake record it provides tells us a history of large  events in the southern and central section of the fault. In northern South Island, the Alpine Fault divides into a number of separate faults know as the Marlborough Fault System. The slip rate (average movement) on the Alpine Fault drops down from about 27mm per year to less than 10, with the remainder being taken up by the other faults nearby. This means that the Hokuri Creek history cannot be applied to the northern (Marlborough) end of the Alpine Fault. This project has been led by GNS Scientists Kelvin Berryman, Ursula Cochran and Kate Clark. The media release about it can be found here, or go to the GNS Science website learning pages here.

A Ticker Tape Record of Alpine Fault Earthquakes Read More »

Imaging the Crust beneath Wellington

Having had a close up look to the surface trace of the Wairarapa Fault (see recent post here), I thought it would be interesting to find out the latest about what such a major geological structure looks like below the earth’s surface. Stuart Henrys and colleagues at Victoria University, the University of Tokyo, Japan, and the University of Southern California, USA, have been busy working on the results of the SAHKE project that ran a large scale seismic survey across the Lower North Island in 2011. The purpose of this survey was to  gain a better understanding of the anatomy of the plate boundary and associated structures below the Lower North Island. This image shows the line of the survey that not only ran across the land surface, but also extended across the sea floor to West and East. Thousands of measurements were recorded, creating a huge dataset that had to be processed to create two dimensional seismic cross sections. SAHKE seismic survey. Stuart Henrys @GNS Science Here is an example of how about 80 kilometres of the section can be displayed to highlight some of the structures in the crust down to 35 kilometres depth SAHKE seismic survey. Stuart Henrys @GNS Science It takes a lot of work to be able to interpret the information to see some of the major structures. You can see that a coherent band of energy deeper than 20 km depth is interpreted to be the plate boundary and descends at a very shallow angle, Also how the Wairarapa and Wellington Faults show up as narrow bands of energy that become low angle thrusts from about 15 kilometres below the surface Stuart Henrys @GNS Science This is a simplified summary of the complete 250 km length of the SAHKE seismic survey: Initially the plate boundary dips at a very shallow angle below the Lower North Island. This angle steepens below the west coast (Kapiti). The blue area is rock that has been scraped off the surface of the Pacific Plate and stuck (“underplated”) onto the base of the Australian Plate. You can think of the Australian Plate acting a bit like a chisel as it scrapes the top off the Pacific Plate in this way, pushing the overlying crust upwards along the Wellington and Wairarapa Faults to give rise to the Rimutaka and Tararua Ranges.  The diagram also shows (in red) where the plate interface is locked (down to about 30 kilometres depth) and the (green) area where it produces slow slip events. Find out more about the potential for very large earthquakes to be generated on Wellington’s Stuck Plate Boundary and also about Slow Slip Events. Tararua Range,  J.Thomson@GNS Science The narrow, long form of the mountains of the Lower North Island may be related to their position above  where the plate boundary dives more steeply downwards with underplated sediments  pushing the ranges up. Cross section of SAHKE seismic survey. Stuart Henrys @GNS Science Here is a more detailed image for you to explore if you are interested, showing some examples of earthquake locations (grey dots) in relationship to the crustal structures: UPDATE 5th Feb 2015:  Have a look at this media release about further groundbreaking discoveries resulting from this research project – “Scientists discover slippery base on underside of Pacific Plate”

Imaging the Crust beneath Wellington Read More »

Wairarapa Fault – the Biggest Rupture on Earth

The Wairarapa Fault is one of New Zealand’s large active faults running along the eastern edge of the Rimutaka range from Palliser Bay north into the Wairarapa. It was responsible for the massive magnitude 8.2 earthquake that violently shook the lower North Island in 1855 in New Zealand’s largest historically recorded ‘quake. This Google Earth view shows the surface trace of the fault, with the Rimutaka Range to the west and the Tararuas in the distance. An interesting location called Pigeon Bush is indicated by the red circle. It is about 50 kilometres north-east of Wellington City. Photo Andrew Boyes / GNS Science The second photo is a view of the Pigeon Bush locality from the nearby road, showing a steep scarp uplifted by earthquake ruptures of the fault. The fault itself runs along the base of the scarp, which is the product of several earthquakes over the last few thousand years. A close up view shows some interesting features beside the fault scarp. Two stream  channels (middle and foreground of image)  appear out of the scarp, with no sign of any catchment gully above them. Meanwhile a bit further along (where the trees are) you can see that there is a deep cut gully in the scarp itself. Geologists have long recognised that the stream that created the two small ‘beheaded’ channels has been shunted along horizontally by the last two ruptures of the fault. In this photo, Rob Langridge, an earthquake geologist from GNS Science, is standing between the first (most recently beheaded) stream channel on the left, and the vegetated gully that was originally connected with it on the right. Some idea of the amount of offset that occurred in the 1855 earthquake can be appreciated from the image. There would also have been some uplift during that earthquake of perhaps one or two metres at this location.  We used a tape measure and recorded the distance along the fault between the centre of the now separated stream gullies, and came up with a figure of about 18 metres. This huge displacement is the largest offset to have been caused by a single earthquake on a land based fault known from anywhere in the world. (It is now known that subduction earthquakes such as the great 2011 Tohoku Earthquake of Japan can produce even greater displacements of the ocean floor) We also measured the offset of the older stream channel which was about 15 metres away from the first beheaded channel.This previous earthquake is thought to have occurred about 1000 years ago. The average repeat interval for ruptures of the Wairarapa Fault is thought to be about 1200 years. Offset stream channels at Pigeon Bush, A Boyes / GNS Science Here is an image taken using a drone and annotated by Andrew Boyes at GNS Science: About 45 kilometres north of Pigeon Bush it is possible to see a view of the fault itself in a cutting of the Ruamahanga River near Masterton. In the photo you can see how older grey rock on the right (west) have been pushed up relative to the younger gravels on the left (east) in a reverse fault. The substantial horizontal movement may also have caused this juxtaposition of older rocks against younger ones. Here is another view of the fault where it is known as the Wharekauhau Thrust in a cliff section at Thrust Creek on the Palliser Bay coast. Royal Society Teacher Fellow Phillip Robinson is inspecting the older shattered greywacke rocks that have been thrust over the gravels from the west (left), tilting the relatively young 50 000 year old gravel layers from a horizontal to a vertical orientation. This is the view looking south from Thrust Creek along to the southern tip of the Rimutaka Range, with Turakirae Head in the far distance. During the 1855 earthquake, a maximum of 6 metres of uplift occurred along this coast. A 10 metre high tsunami also swept along this coastline. Check out this previous post to learn about the amazing uplifted beaches at Turakirae Head. Note that you can now find out how to visit Thrust Creek (and many other geology locations) on our GeoTrips website here: https://geotrips.org.nz/trip.html?id=255

Wairarapa Fault – the Biggest Rupture on Earth Read More »