GeoTrips

Where to explore the Wellington Fault

Wellington Fault at Thorndon

The Wellington Fault is one of several large active faults in the lower North Island of New Zealand. From the Tararua Mountains and Kaitoke it runs the length of the Hutt Valley, the edge of Wellington Harbour, through Tinakori in the City and across the hills to Cook Strait. Earthquakes occur on the Wellington Fault approximately every 700 to 1000 years on average, with the last between 170 and 370 years ago. The probability of a rupture in the next 100 years is calculated to be about 10%. Because it runs along the highly populated Hutt Valley and right through the Capital City via its transport bottleneck, it is regarded as one of the country’s highest risk faults. You can find out information about all of New Zealand’s known active faults on the GNS Science Active Faults Database, but in this image you can see a screen grab of those known in the Wellington area, some of them labelled: As you can see there are many other faults in the region, each of which is capable of rupturing, so that the real possibility of a large earthquake occurring at some point from one or other of the faults is something that should inspire everyone to be prepared. (Make some time to go to https://getready.govt.nz/ ) As you can see there are many other faults in the region, each of which is capable of rupturing, so that the real possibility of a large earthquake occurring at some point from one or other of the faults is something that should inspire everyone to be prepared. (Make some time to go to https://getready.govt.nz/ to get the best information on how to do this.) Here is an aerial view of the Wellington Fault trace (bottom right to centre top of the photo) passing through California Park in Upper Hutt and along the centre of  California Drive beyond In neighbouring Harcourt Park, the fault crosses a flight of river terraces at a right angle. This allows us to see clearly that the slip (movements) on the fault are mostly horizontal with some vertical movement as well. Looking across the fault the opposite side moves to the right. This means that the fault is a “dextral oblique slip fault”.   This diagram shows how the Harcourt Park River Terraces are offset by the Wellington Fault The fault can be followed along the Hutt River. In Lower Hutt it runs right along the side of Hutt Road, and into Petone. This photo shows the fault scarp at the end of Te Mome Road where it meets Hutt Road at a T junction:   The entrance to Wellington City at Thorndon is a bottleneck, where the Wellington Fault passes underneath the railway, State Highway and Ferry Terminal, as well as the water supply. This makes Wellington vulnerable to being cut off by a rupture of the Wellington Fault. You can learn more by visiting the Wellington Fault at several points from Upper Hutt to Wellington. Check out this video for details:  

Where to explore the Wellington Fault Read More »

Volcano City

Mangere Mountain, L. Homer / GNS Science Volcanic cones, explosion craters and lava flows form much of Auckland’s natural topography. All of these, apart from one (Rangitoto Island) are from vents that erupted once only (monogenetic), with eruptions lasting a few weeks or months and then ceasing completely.  There are many accessible and beautiful locations that can be visited to uncover the geological history of the area. Auckland volcanoes, GNS Science Although there are about 50 volcanoes within a 20km radius of the city, there is a similar eruption process that generated them, with three main possible styles of eruption. Knowing the difference between these eruption styles allows you to interpret the different features and rock types of each of the volcanoes that you might wish to explore. The magma that erupts in the Auckland Volcanic Field (AVF) is generated in a ‘hotspot’ about 80 to 100 kilometres below the surface. It is a very fluid type of basalt that is known to rise quickly to the surface (at up to 5km / hour) from the magma source. Tuff outcrop at North Head, J..Thomson / GNS Science Once at the surface, the style of eruption depends largely on the amount of groundwater or sea water present. If there is a lot of water near the vent, its interaction with the hot magma (1000 plus deg C) causes it to instantly vaporise.  This, along with the expansion of gases within the lava itself, creates extremely violent eruptions that fragment the lava into small particles and blasts them upwards and sideways from a wide, flat explosion crater. This becomes surrounded by a ring of ash. Such deposits are known as tuff (pronounced ‘toof’ as in ‘woof’). You can see outcrops of this in Auckland, for example around the shoreline at North Head. Each individual layer represents an explosion from the vent. Surtsey eruption, courtesy NOAA This type of eruption is known as a phreatomagmatic or wet eruption, and a classic example occurred off the coast of Iceland from 1963-67 when the island of Surtsey was born. Mount Eden Crater, J.Thomson / GNS Science Scoria outcrop, Mount Wellington, J.Thomson / GNS If the magma reaches the surface where there is little interaction with water there is a different type of eruption. This includes eruptions in areas of dry land, as well as those that start off as wet eruptions, but where the water supply near the vent gets used up before the supply of erupting magma runs out. The magma then erupts in a fountain of lava, driven up by gases within it that are expanding as the pressure is reduced.The lava fountains might be several hundreds of metres high, with blobs of lava partially solidifying in mid-flight, and landing as scoria in a ring around the vent. This is a bit like the froth coming out of a soda bottle once the lid has been removed.  The scoria pieces and lava bombs are relatively sticky and can build the steep sided cones that are very recognisable in the Auckland landscape. The reddish colour comes from the oxidation of iron in the magma as it cools during its flight through the air. Lava bomb approx 1/2 m in length, Mangere Mountain  If you look at the rock that makes up these cones, you will see that it is made of bombs and fragments that may be partially glued together or more or less loose and rubbly. Takapuna lava flow, J.Thomson / GNS Science If one of these eruptions gets to the stage where the gas has mostly been expelled, then there is less energy available and the fire-fountaining stage ends. Should the eruption continue (which is not always the case) then the third eruption style starts to dominate. Lava pours out of the vent and pushes through the sides of the scoria cone to spread out around the volcano. Because it is such a fluid type of lava, a  variety of flow structures are preserved when it finally solidifies. Lava tree mould with bark impression, J.Thomson / GNS A great example of such a lava flow can be found along Takapuna Beach. About 200,000 years ago lava poured out of the nearby Pupuki crater and flowed through a forest. The tree trunks and branches were surrounded by the lava which cooled around them. The trees then burnt, leaving tree shaped holes within the lava. Takapuna Fossil Forest and Rangitoto, J.Thomson / GNS For more information about where to go in Auckland to see some of these geological localities, have a look at our new online map of geological locations atwww.geotrips.org.nz Could a volcanic eruption occur in Auckland in the future? What are the probabilities in the short to medium term and what would the impacts be? The short answer to the first question is ‘Yes,  definitely!’ There is no reason to think that eruptions won’t occur again. In order to answer the last two questions (‘When?’ and ‘What?’) it is important to get as clear a picture as possible of the history of past events, their timing, duration and magnitude, and their geographic relationship to the housing and infrastructure in the wider Auckland area. Auckland Museum Volcanic Eruption Auckland City and Mount Victoria, J.Thomson / GNS These questions are the focus of a long term scientific programme called DEVORA (Determining  Volcanic Risk in Auckland). DEVORA is led by GNS Science and the University of Auckland, and is core-funded by the EQC and Auckland Council. The first part of this programme has been to further our knowledge of the eruption history of the Auckland Volcanic Field volcanoes. What this work has shown is that there is no simple pattern that we can project to help easily forecast the likelihood of eruptions in the future. The timeline of eruptions shows them to be clustered, with large gaps between phases of relatively high activity.  Graham Leonard, photo by Brad Scott / GNS Graham Leonard of GNS Science is a co-leader of the project. He comments

Volcano City Read More »

GeoTrips – visiting New Zealand’s geology and landforms

The Tasman Glacier Lake from the air

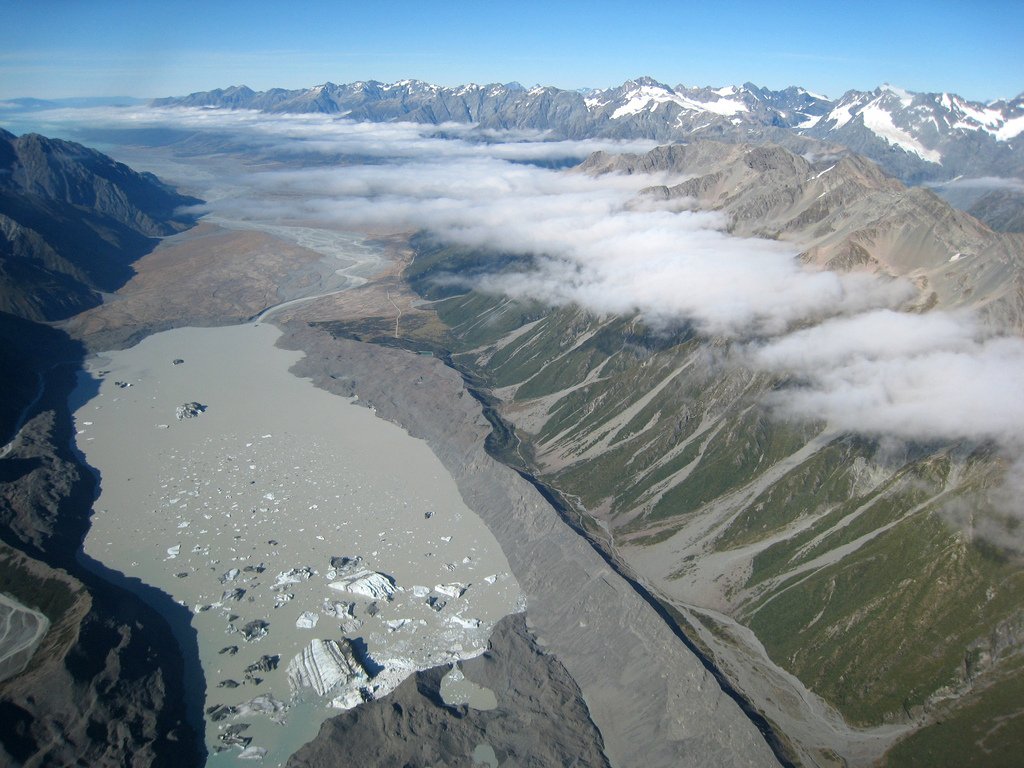
Tasman Glacier Lake,  J.Thomson / GNS Science New Zealand is an isolated country with a very active plate boundary running right through it. For a relatively small landmass it has an astonishing variety of landscapes and is being continuously subject to dramatic physical occurrences that include earthquakes, volcanic eruptions, floods, landslides, rapid erosion and sedimentation. The geology of New Zealand can be explored in innumerable individual localities that each give individual insights into the geological story, like pieces of a jig saw puzzle. In order to visit these locations, a non specialist normally has to seek information in widely scattered sources such as specialist papers, local guidebooks, various websites or visitor centres. Many of these are out of print or out of date, and hard to get hold of. To overcome this issue, GNS Science has created a New Zealand geological locations map that allows interested people (eg members of the public, researchers, teachers and students) to have the information they need to explore our geology first hand. The content is provided by geoscientists and is aimed to encourage you to go to these localities and make your own observations, just like scientists do. As well as some geological background, there are images, directions, and some basic safety and accessibility information too. You can search the map using filters to focus on specific topics, rating scales or accessibility.  So… have a look, explore and plan some trips to become a New Zealand geological investigator!  www.geotrips.org.nz  

GeoTrips – visiting New Zealand’s geology and landforms Read More »

Stepping Over the Boundary

This is a classic view of the Southern Alps from Lake Matheson on a still morning, showing the high peaks of Mount Tasman and Mount Cook.The Alpine Fault runs along the foot of the steep rangefront, extending right up the West Coast of the South Island. The mountains are therefore part of the Pacific Plate and all the flat land in front, made up of glacial outwash gravels, is on the Australian Plate. This graphic shows the Alpine Fault as a very distinct line dividing the high mountain topography to the East and from the coastal lowlands along the West Coast. Arrows show the horizontal directions of fault ruptures along the fault, but there is also a vertical component that is pushing up the Southern Alps. At Gaunt Creek near Whataroa, you can get right up close to a cliff exposure of the Alpine Fault.  The pale green rocks in the foreground have endured being crushed and uplifted along the  fault line. They have been altered into what is known as cataclasite, consisting of clay and lots of crushed rock fragments.You can visit this location by checking out our GeoTrips website here: www.geotrips.org.nz/trip.html?id=57 The low angled line of the Alpine Fault is very distinct on the right side of the photo, with the metamorphosed cataclastic rocks that have been uplifted from kilometres down in the crust being pushed over the much younger gravels to the West (right). You really can put your finger on New Zealand’s plate boundary here! The Pacific Plate is on the upper left, thrust over ice age gravels of the Australian Plate on the right hand side of the image. The photo gives a good impression of the nature of the crushed rocks. A more distant view of the cliff section from the creek shows how the uplifted rocks have over-ridden the gravels which are about 15 to 16 thousand years old. The two white arrows show the line of the fault. A short distance away is the Deep Fault Drilling Project (DFDP1) Observatory that was set up after two boreholes were drilled here in 2011. The fault is dipping at about a 40 degree angle, and the boreholes were positioned to intercept it at around 100m depth. Instruments down the boreholes include seismometers and other sensors that have been installed to better understand the physical conditions along the fault as it extends down below the surface. For a bit more background to the DFDP have a look at this previous post from 2011

Stepping Over the Boundary Read More »

The Fox

A visit to Fox Glacier shows that changes over the last 5 years are similar to those at the Franz Josef Glacier.  Here is a view of the Fox Glacier front in 2009:  And this year (March 2014): The terminal face from another angle in 2009… …and as it was recently in 2014. The grass covered hummock in the centre marks the previous limit of the ice. There is a good view down onto the glacier from the moraine wall that can be accessed via a well made track. It is apparent that the glacier has not just got shorter, but the whole surface has lowered by tens of metres. This view of the present terminus shows that unlike the Franz Josef glacier, the Fox can still be accessed by climbers and guided groups. However, the future outlook is similar to that of the Franz. Update March 2015 – timelapse video of Fox Glacier terminus retreat through 2014 by Brian Anderson (Victoria University Wellington).This amazing timelapse shows how the moraine walls of the glacier are affected when the buttressing effect of the ice is removed. Worth watching through a couple of times to catch the details: Fox Glacier’s spectacular retreat from Brian Anderson on Vimeo. Have a look here for information about visiting the Fox glacier, which is one of the locations on our GeoTrips website:  www.geotrips.org.nz/trip.html?id=244 

The Fox Read More »

Franz Josef Ice on the Retreat

Franz Josef Glacier 2009 – Julian Thomson GNS Science Recently I visited the West Coast Glaciers and was interested to see their condition after my last visit 5 years ago in 2009. Franz Josef 2009- Photo Eric Burger These photos give and immediate comparison of Franz Josef Glacier over the last 5 years: In 2009 the glacier filled the head of the valley with its spectacular ice falls. It was easy to walk onto the glacier with the appropriate equipment – crampons and ice axe. Franz Josef 2014- Julian Thomson, GNS Science 2014 – a big difference! The ice is now no longer apparent on the floor of the main valley, and only the distant ice of the upper ice fall can be seen. The glacier terminus has melted back by about 500 metres. From closer up, this is where the terminus of the glacier was in 2009. You can see that rock debris now covers the area. The exposed wall of the valley on the left shows where the ice level was in the late 1990s. The mound on the right is actually an isolated heap of ‘dead’ (stationary) ice that has been protected from melting by the insulating effect of rock fall debris that fell onto part of the glacier several years ago. The hollowed out and unstable ice and rock is the reason why tourists are not allowed to go any further up the valley than this. Some of the boulders are smoothed and rounded, having been dragged along at the base of the glacier before being dumped where the ice melted. Huge jagged boulders like this one will have fallen onto the surface of the glacier from the adjacent cliffs. They have not been smoothed by any scraping action along the bed of the glacier. This ridge of boulders running from the foreground into the centre distance of the image is one of several small terminal moraines left recently by the retreating ice. The glacier is now away to the left of the image. Is this a view of the long term future of Franz Josef, or will this barren pile of debris be over-ridden again by the glacier again sometime soon? Measuring summer melting at Franz Josef 2009 To explore this question further we need to understand a bit about the dynamics of a glacier. (For more in depth information about processes of glacier formation have a look at our GNS glacier page here.) On  top of a general understanding, we also have to consider some of the unique characteristics of Franz Josef glacier, and its sister, the Fox.  Franz Neve,  Julian Thomson GNS Science Lloyd Homer GNS Science With extremely high snowfall over a large accumulation zone and a steep, narrow valley that funnels the ice quickly to a very low altitude, the Franz Josef and Fox glaciers are the most sensitive in the world to climate change. Residual snowfall at the top of the glacier at the end of the summer melt season has been measured at over 8 metres of water equivalent per year. Ice melt at the terminus is around 20m w.e./ year which is the highest annual melt rate known for any glacier. The loss of ice of the lower glacier is replaced by very rapid flow rates of up to 2.5 metres per day that transports the abundant accumulation to lower altitudes. This dynamism is the cause of the sensitivity of the glacier to changes in average snowfall or temperatures which are reflected in an adjustment of the terminus position (glacier front) in only about five to six years. From 1890 to about 1980 the Franz has retreated by over 3.5 kilometres, interspersed with 3 or 4 re-advances of several hundred metres lasting roughly 10 years each. However, from about 1980 to 2000, there was a more substantial re-advance of 1.5 kilometres. This has been associated with regionally wetter and cooler conditions brought about by a phase of more El Nino conditions. These in turn relate to a fluctuating climate cycle called the Inter-decadal Pacific Oscillation. However, while the Franz and Fox were re-advancing, other glaciers in the Southern Alps with longer response times,continued to lose ice as they were (and are) still responding to the general warming of the 20th Century. Mount Cook and Hooker Valley,   J. Thomson GNS Science Overall from the 1850s to about 2007, it has been calculated that 61% of the ice volume of the Southern Alps has been lost, and from 1977 to 2005 there was a 17% reduction in ice volume. mainly because of massive calving into lakes that have formed at the termini of the Tasman and other valley glaciers, and also the continued downwasting ( i.e. surface lowering due to high rates of melting) of these larger glaciers. Re-advances of the Franz Josef, when they occur, have to be understood against the underlying trend of a warming climate. In the light of this, we can expect that, subject to temporary fluctuations, our cherished view of the Franz Josef’s terminal ice face from the approach walk has a rocky future. An excellent information leaflet about the Franz and Fox glaciers is available from GNS Science: Franz Josef Glacier features on our GeoTrips website, in case you want to go there: www.geotrips.org.nz/trip.html?id=245

Franz Josef Ice on the Retreat Read More »

Opunake

Another great geological venue on the South Taranaki coast is at the Opunake boat ramp, where we took our Geocamp participants recently. On two sides of the car park there are cliffs showing a spectacular sequence of strata. information for you to visit this spot is on our GeoTrips website here: www.geotrips.org.nz/trip.html?id=56 It’s a perfect spot to practice drawing a geological section and making detailed observations. Drawing is very valuable as it forces you to be careful and attentive to details. The observations lead to the next question. What can these rocks tell us about the processes that put them in place? These colourful orange, grey and yellow bands contain numerous volcanic clasts (pebbles and boulders) suggesting that they have originated from the Taranaki / Egmont Volcano, an obvious source about 25 kms north-east of Opunake. Generally when you see stratification in a rock it suggests that it has been laid down in moving water (or from the air in some cases such as volcanic ash layers or sand dunes).  This layer shows well developed graded bedding – the larger particles were laid down first, followed by finer and finer material. The very coarse unit above indicates another very high energy phase of deposition. In some places you can find very large boulders that have been deposited and left in scoured out hollows that have then been infilled with finer material. In  this image you can see a channel on the right of centre that has cross cut the horizontal layers and been infilled with gravel. This also shows that the sedimentation process was occurring in a high energy environment. So a fair interpretion of the Opunake sequences is that of volcanic material that has been eroded off Mount Taranaki and deposited in a fluvial (river) environment, possibly as reworked lahars or debris flows that have been mobilised by floods. If you take a look at the landforms on the slopes of Mount Taranaki, you can see numerous gullies and larger valleys where the rocks have been eroded away, either by rivers, lahars or rock slides. Occasionally there have also been the massive debris avalanches such as the one that covered the forest at Airedale Reef)   Over time the mountain has produced the material that blankets hundreds of square kilometres of the surrounding plain. Here is the geological Qmap for Taranaki. The red rocks are volcanic lavas and related rocks centred on Taranaki / Egmont Volcano, whilst the pink rocks are pyroclastic and debris flow deposits. Opunake is on the coast  half way up the map on the left. You can see the profound effect of the volcano on the landscape, as it is at the centre of a radial arrangement of volcaniclastic deposits.  The volcanic rocks have been  spread across the landscape for large distances by the power of gravity and water.

Opunake Read More »

Waihi Beach Taranaki

The South Coast of Taranaki near Hawera has extensive rocky beaches lined by high crumbling cliffs. It is a great place for geology, but you should be wary of the potential for cliff falls, especially after rain. This is the view east from the Ohawe beach access point. A first look at the cliff from a safe distance shows that it is made of two main rock types; massive grey muddy sandstone at the bottom, with darker brown soft stratified layers above. The boundary between the two layers is very distinct and can be seen for many kilometres along the coastline. If you take a closer look at some of the muddy sandstone boulders lying on the beach, you can find some nice fossils such as this scallop. In places these rocks are very bioturbated. In other words they have been churned up by organisms that burrowed through them when they were part of the sea floor. For a close up look at the boundary between the two layers that form these cliffs, a good place to go is the beach access track 4.5 kilometres east at Waihi Beach (end of Denby Road see www.geotrips.org.nz/trip.html?id=55 for location and geological info). There, right before you reach the beach, is an easily accessible outcrop where you approach the boundary safely.   Here is a slightly closer view – you can see the change from the lower grey unit containing oysters and scallops with the shell rich layers above. The fossils in the lower unit indicate an environment of deposition about 20 to 50 metres deep. This layer is approximately 3.5 million years old. Here is another image where can see the incredibly abrupt change from the lower muddy sandstone to a much looser sandstone packed with shells. Just below the boundary there are some vertically positioned shells in a line. These have burrowed down into the sediment from above and have been preserved in life position. Although they are found within the 3.5 million year old sandstone, they are actually only as old as the overlying shelly layer, which is about 125 000 years old . This means that the 3.5 million year sea floor sediment has been uplifted, eroded down to sea level, and then covered with shelly beach or estuarine deposits of much younger age. Nearly three and a half million years are missing from the sequence. Interestingly the same unconformity is widespread across Taranaki. Here you can see it at Wai-iti Beach on the north coast. Here the time gap is even greater, as the underlying grey sediments are about 8 million years old and represent deposition at about 500 metres water depth. This shows that there has been greater uplift and erosion in the north compared to the south Taranaki coast.Here is a video of Kyle Bland explaining the Waihi outcrop and the story revealed by fossils:

Waihi Beach Taranaki Read More »

Airedale Reef

Earlier this week I was up in Taranaki, exploring the geology of the area  with two GNS Science researchers Kyle Bland and Richard Levy. One of the sites we visited was Airedale Reef, a short walk east along the coast from the mouth of the Waitara River. There are spectacular remnants of an ancient forest on the shore platform at low tide, with tree stumps in growth position and large logs sitting in a black layer of peaty soil. The forest layer reappears at the base of the nearby sea cliffs, with the roots and tree stumps gradually being eroded out. Just below the dark layer is an olive green bed of dune sands. The carbon rich forest layer is thickest in the depressions between the dunes. This  is one of the tree stumps emerging  from the cliff. But how long ago was this forest still living? How did it die and why was it preserved like this? The answers are in the layer just above it. This overlying layer is made of an unsorted mixture of different boulders and less coarse particles of rock. You can also find chunks of carbonaceous material scattered within the layer that must have been ripped up into it as it was emplaced. This 4 metre  thick layer of material has been mapped  over a minimum area of 255 km2 around north Taranaki, and has a total volume of at least 3.6 km3. It is believed that Mount Egmont (Taranaki) volcano is the source of this layer. Like some of our other andesitic volcanoes, Mount Egmont is made up of layers of unconsolidated volcanic deposits interbedded with more massive lava flows. Because the slope angle of the volcano is very steep, the cone is inherently unstable, resulting in occasional enormous avalanches of debris launching down the mountainside, spreading across the surrounding countryside and out into the sea for distances of up to 40 km from the source. For this reason Egmont is a significant geological hazard that is monitored by GeoNet. On our visit up the  mountain the following day, amidst the lava flows and ash layers we could see deposits such as these – not too different from the bouldery layer at Airedale Reef, although likely to be much younger. Back at Airedale Reef this photo shows a good view of  the layer that buried and destroyed the fossil forest. It is known as the Okawa debris avalanche deposit and has been dated at about 100 000 years old. This means the forest was growing during the last interglacial period. Pollen analyses shows a dense podocarp forest, but lacking specifically coastal plants. It seems that when the forest was alive, the coast was further out than its present position. Rimu Pollen  (Dacrydium cupressum) 43 microns across There is a lot of pollen preserved in the Airedale Reef cliff section. Scientists found over 10,000 pollen grains per cm3 in places.They were analysed to study the plant communities from the period of time represented by these layers. Cyathea treefern spore, diameter 30 microns  This allows research into climate variations through time, as different species appear and disappear up through the cliff section from the base to the top. The Rimu and tree fern species in these two images indicate a lush podocarp forest that grew in warm, wet conditions. In the next layer above, the species found represent a sub-alpine shrubland community that grew in a cooler climate. In this photo you can see two pale coloured tephra (volcanic ash) layers near the top of the carbon rich layer, showing periodic eruptive activity from the volcano. In the last image you can see that another carbon rich layer formed in a depression at the top of the Okawa Formation (centre left). Above that the rest of the section is made up of orange and pale brown soils.

Airedale Reef Read More »

Tongariro North Crater

Earlier this week I decided to spend the night camping up on the North Crater of Tongariro. This is the large flat crater that is off to the north and west of the main track of the Tongariro Crossing. For access information have a look at the GeoTrip page here: www.geotrips.org.nz/trip.html?id=279Here is a view across to it from near to the Red Crater: The crater is about 1 km across, and is believed to have once been a lava lake several thousand years ago. In the distance you can see the crater rim to the right of the cone of Ngauruhoe. The surface of the ground is uniformly covered with scattered blocks of lava. This windswept area feels isolated and rarely visited, even though it is so near to the Tongariro Crossing track. There is a spectacular explosion crater within the North Crater itself, over 300 metres across and about 50 or more metres deep. It has broken through and partly obliterated the surface of the solidified lava lake. A low angle valley cutting across the main crater represents the line of a fault. Debris from the explosion crater to the left of the image has partly filled the valley. This photo taken by Lloyd Homer in 1984 shows two more faults (dark lines) crossing the slopes on the western flank of Tongariro. They are normal faults, indicating extension of the crust that is associated with the volcanism in the North Island. They have been active since the Taupo eruption 1800 years ago The Tongariro Crossing passes just below and east of North Crater. There is a barrier prohibiting closer access to the Te Maari Crater / Ketetahi area  . This is the 2 km exclusion zone due to continued volcanic eruption hazard. From the edge of North Crater, there is a view down to Ketetahi Hut and across to Upper Te Maari. It is sobering to think that the hut was damaged by large flying rocks erupted from Te Maari about 2 km away during the August eruption. If you click on the image to enlarge it you can see the hut near the left side of the photo. This was the view at sunrise, looking down on to the steam plume coming from Upper Te Maari.Crater.

Tongariro North Crater Read More »